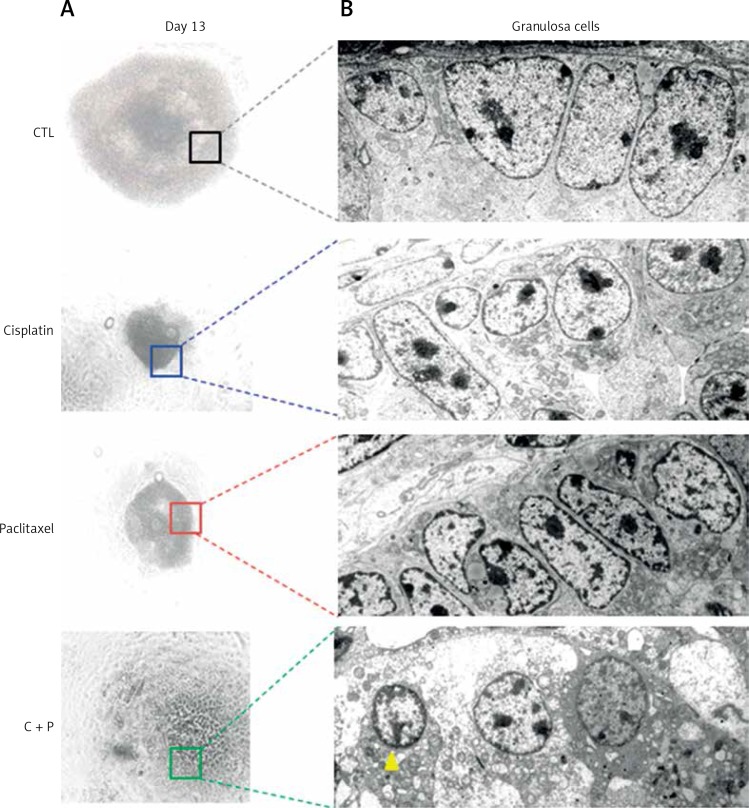
Figure 6.
Microstructure of chemo-reagents treated follicles. A – Microscopic image of in vitro matured, chemo-reagent treated follicles, magnification: 100. B – Ultra-structural analysis of G-cell using transmission electron microscope, magnification: 5000. The yellow arrow indicates precipitated metabolic droplet

