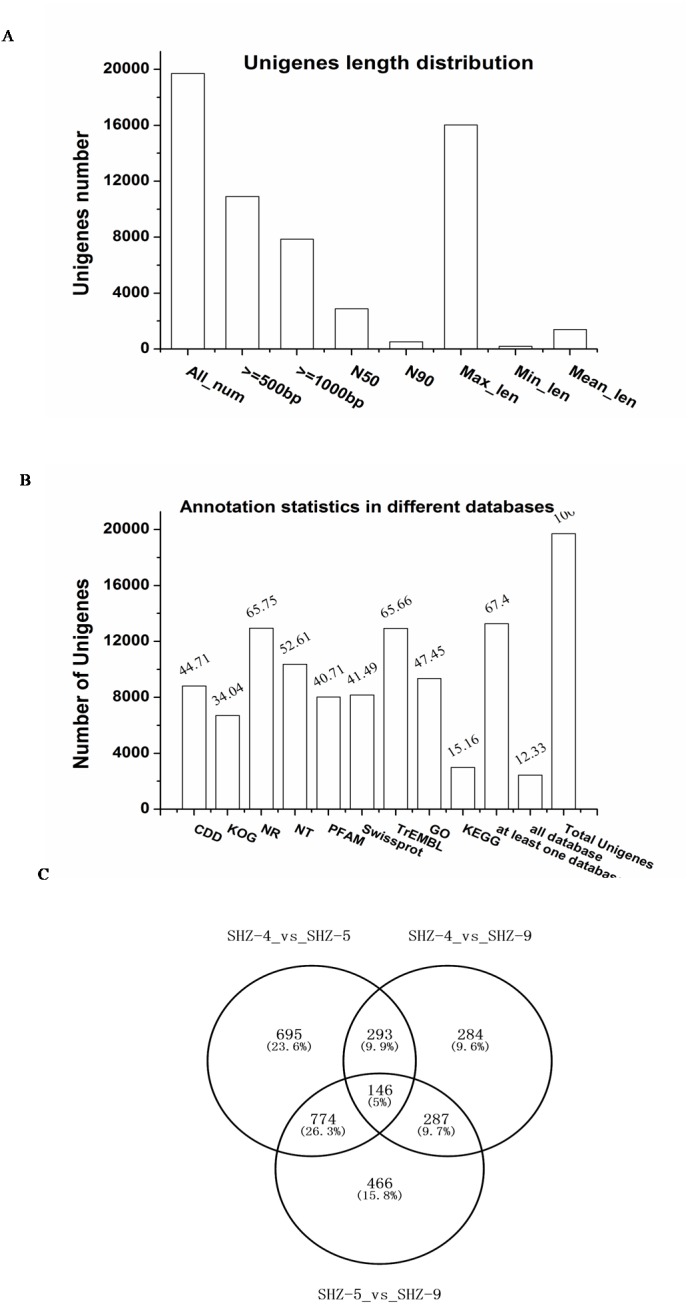
Figure 2. Transcriptome assembly and annotation statistic.

(A) The unigenes length distribution satistic after transcriptome assembly; (B) the statistics of unigenes annotation in different databases; (C) Venn diagrams of comparisons between the DEGs of the strains.
