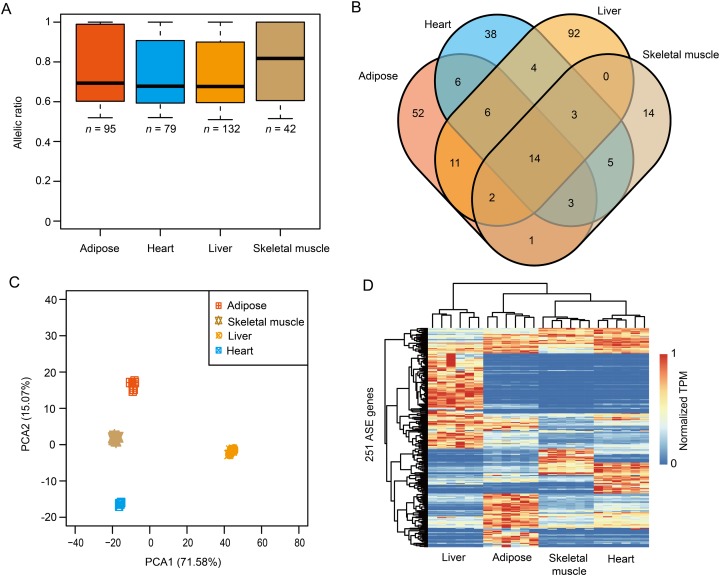
Figure 4. The results of ASE genes.
(A) A total of 95, 79, 132 and 42 ASE genes were identified in adipose, heart, liver and skeletal muscle, with a median value of allelic ratio ranged from 0.68 to 0.82. (B) The venn diagram of ASE genes among adipose, heart, liver and skeletal muscle. (C) Principal component analysis (PCA) of the 251 nonredundant ASE genes. (D) Heatmap of the 251 nonredundant ASE genes.

