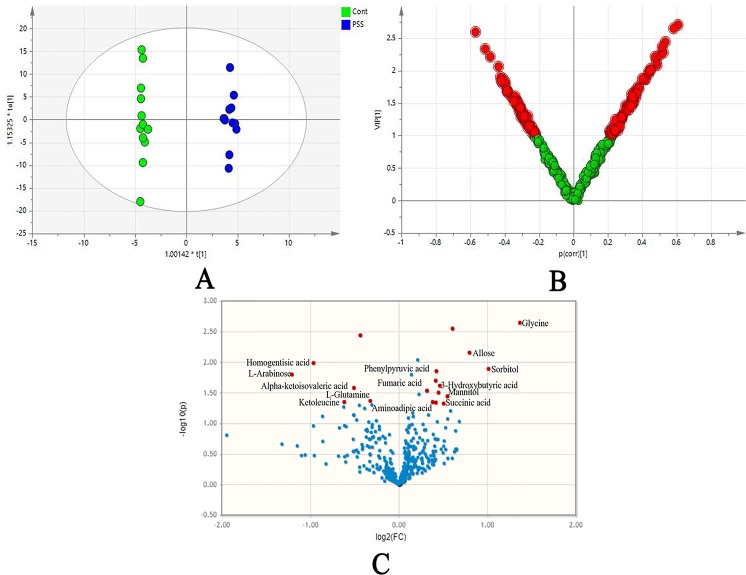
Figure 2.
The orthogonal projection to latent structure-discriminant analysis (OPLS-DA). OPLS-DA score plots (A) showed clear differences obtained for PSS versus control groups; loading plot (B) presented significantly disturbed metabolites in red (VIP 1); volcano plot (C) illustrated metabolites with their association with PSS, demonstrated as fold difference (x-axis) and p value (y-axis). PSS, Posner–Schlossman syndrome.

