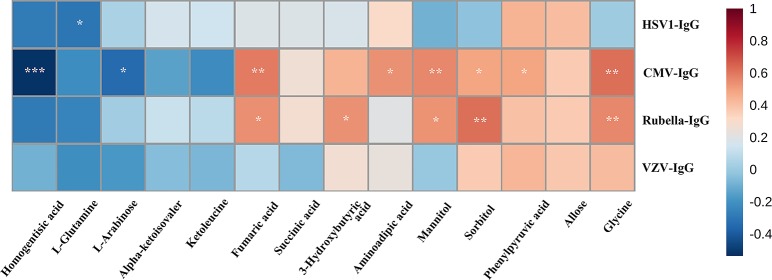
Figure 3.
Spearman’s rank correlation analysis. Spearman’s rank correlation analysis performed between 14 differential metabolites and anti-virus IgG concentration. Red, positive correlation; blue, negative correlation. CMV, cytomegalovirus; VZV, varicella zoster virus; HSV, herpes simplex virus. *, adjusted p value 0.05; **, adjusted p value 0.01, ***, adjusted p value 0.001.

