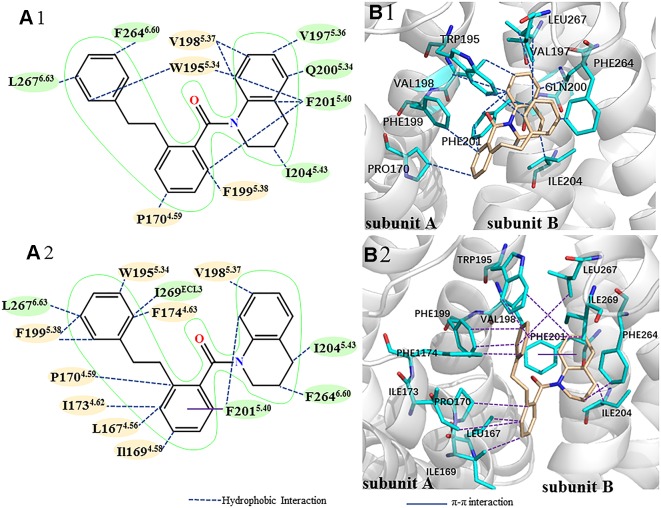
Figure 7.
The comparison of binding modes between the CXCR4 dimer and the PPI ligand before (Top) and after (Bottom) 1us simulation. (A) 2D diagram of binding mode between the CXCR4 dimer and the ligand (yellow represents residues from the subunit A, green represents residues from the subunit B). (B) 3D diagram of binding mode between the CXCR4 dimer and the ligand, blue for residues, orange for the ligand. Hydrophobic and π-π interactions are represented by different lines.

