Figure 1.
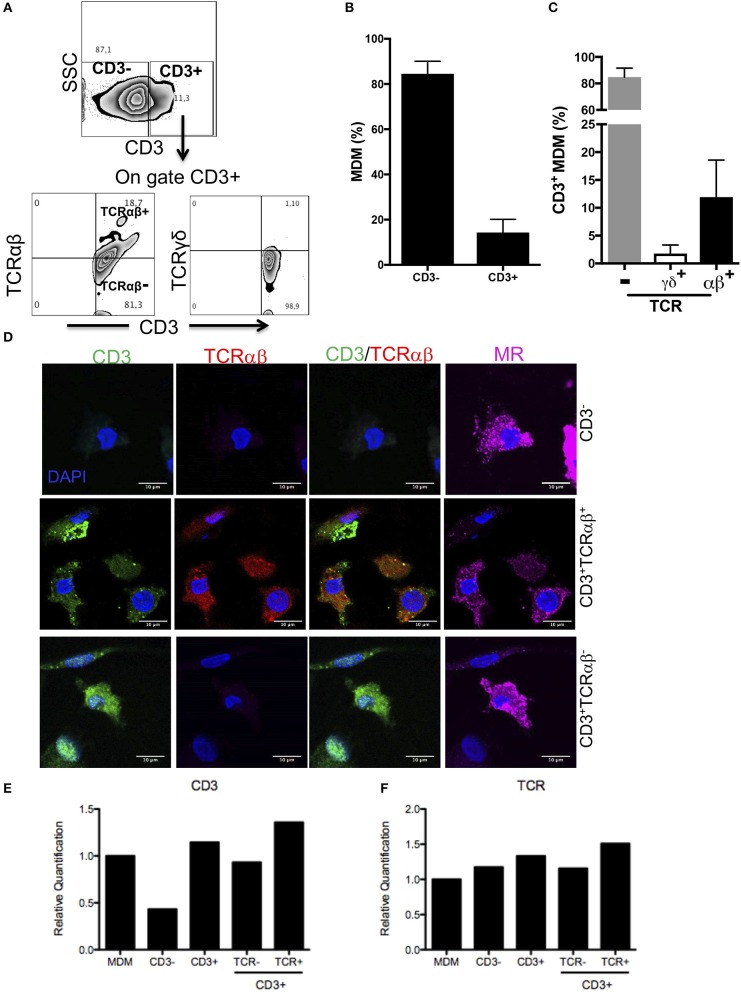
Human MDM give rise to CD3+TCRαβ+ and CD3+TCRαβ− cell subpopulations. Human monocyte-derived-macrophage were obtained, and CD14+ cells were harvested after 7 days in culture and prepared for flow cytometry, confocal microscopic or q-PCR. (A) Representative zebra plot showing analysis strategy to identify CD3+ MDM (up) and co-expression of TCR αβ or γδ chains (down). Frequency of (B) CD3+ MDM, (C) CD3+TCRαβ+, CD3+TCRαβ−, and CD3+TCRγδ+ MDM subpopulations. The bar graphs show the mean ±SD of n = 10 healthy donors. (D) Immunofluorescence stained for CD3 (green), TCRαβ (red) and mannose receptor (magenta) and DAPI (blue) was used to identify nucleus. The scale bar 10 μm data are representative of three independent donors. In the purified subpopulation (E) CD3 epsilon-chain and (F) TCR beta-chain, relative gene expression was evaluated by real-time PCR. The bar graphs show the mean, and the data are representative of two independent donors.

