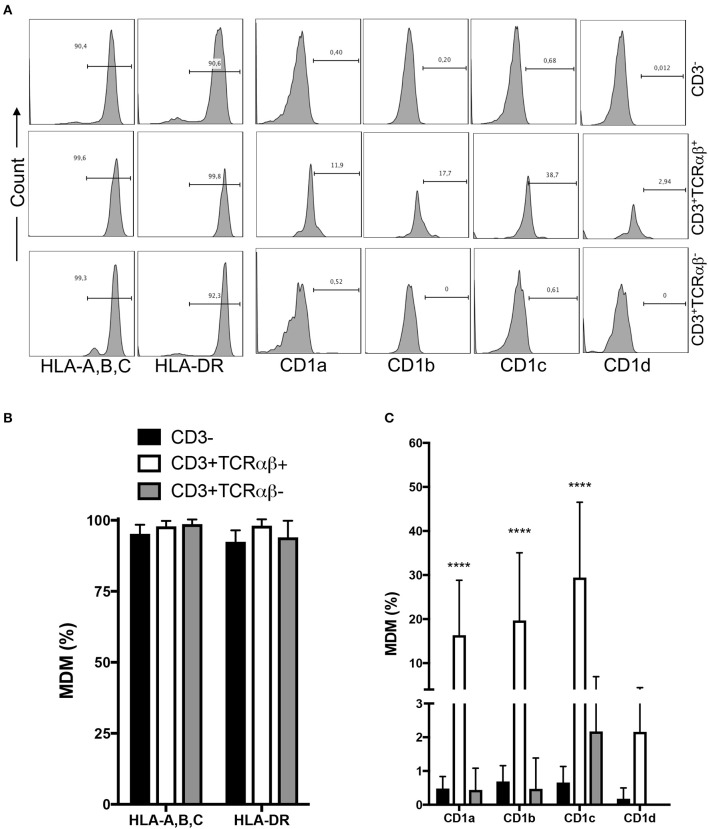
Figure 2.
Human CD3+TCRαβ+ and CD3+TCRαβ− macrophage subpopulations express HLA family molecules, but only CD3+TCRαβ+ co-express a CD1 family member. Human monocyte-derived-macrophage were obtained at the 7th day post-culture and prepared for flow cytometry; the CD3+ MDM subpopulations were delimited. (A) Representative histogram showing the expression of HLA-A,B,C, HLA-DR, CD1a, CD1b, CD1c, and CD1d inside of each CD3+ MDM subpopulation. (B) Frequency of MDM subpopulations expressing the molecules of the HLA family. (C) Frequency of MDM subpopulations expressing the molecules of the CD1 family. The bar graphs show the mean ± SD of n = 8–10 independent donors. A statistical analysis was performed by two-way ANOVA with multiple comparisons, followed by a Tukey test. ****p < 0.0001.

