
Figure 4.
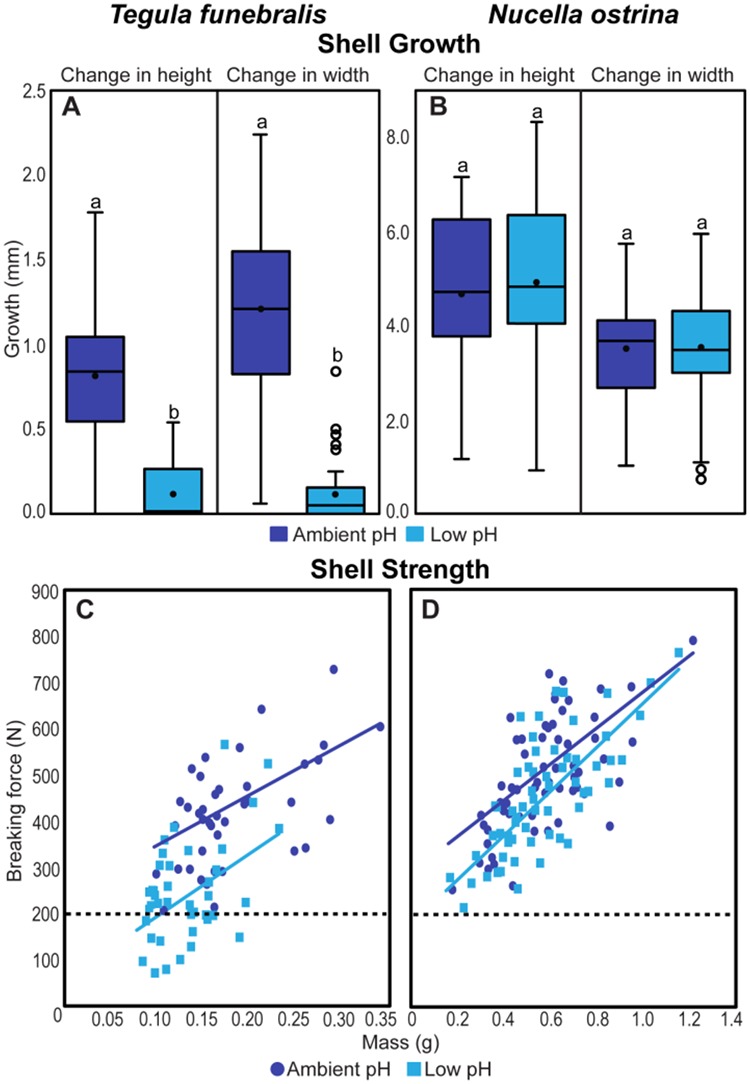
Shell growth and strength of the black turban snail, T. funebralis, and the striped dogwhelk, N. ostrina after 185 days of exposure to decreased seawater pH (pH ~ 7.4, half a unit lower on the total scale than ambient seawater). Note that the axes differ between left and right panels given the different growth and strength patterns of Tegula (left) and Nucella (right). (A and B) Boxplots of new shell growth (both height and width) measured over the 185-day experiment (n = 40 per treatment). Ambient treatments are in dark blue, manipulated (decreased) pH treatments are in light blue, with boxes indicating upper and lower quartiles, central lines indicating medians, means as black circles, and whiskers representing min/max data. (C and D) Scatterplots of shell strength (n = 20 and 30 per treatment for Tegula and Nucella, respectively). Mass (g) of dried shells was used as a proxy for size. Maximum force (N) values indicate forces exerted at the point of total shell failure. Dark blue (ambient pH) and light blue (low pH) trend lines indicate best-fit regressions. The black-dotted line at 200 N indicates conservative crushing forces exerted by adult crabs of C. productus (Taylor, 2000). Modified from Barclay et al. (2019).