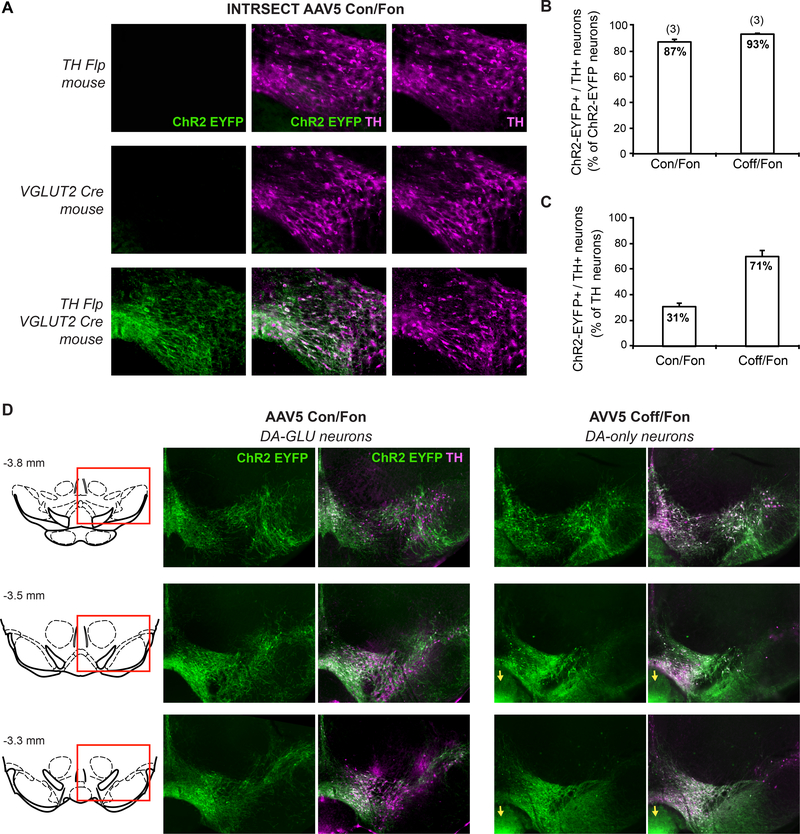
Figure 2 – Visualization ofDA-GLU and DA-only neurons using the INTRSECT combinatoric strategy.
A. Photomicrographs of the VTA assessing expression of ChR2-EYFP after intra-VTA injections of INTRSECT AAV5 Con/Fon in three different mutant mice: TH Flp, VGLUT2 Cre, and TH Flp;VGLUT2. Cells and processes labeled by the Con/Fon virus and showing EYFP immunoreactivity (left photomicrograph) are only visible in mice that express both Cre and Flp, validating the combinatoric strategy. B. Graphs displaying the specificity of the INTRSECT Con/Fon and Coff/Fon viruses, measured as the percentage of ChR2-EYFP positive neurons expressing TH in the VTA. Numbers of mice used are indicated above the bars. C. Summary of average percentage of TH+neurons in the VTA expressing either INTRSECT AAV5 Con/Fon or Coff/Fon. D. Photomicrographs of the VTA showing the distribution of the cells expressing either AAV5 Con/Fon (DA-GLU neurons; left panels) or AAV5 Coff/Fon (DA-only neurons; right panels). Ectopic expression of the AAV5 Con/Fon in the interpeduncular nucleus is indicated by yellow arrows. Numbers above the schematic coronal slices (left) are distance from bregma. These results are original data that have not been been previously published.

