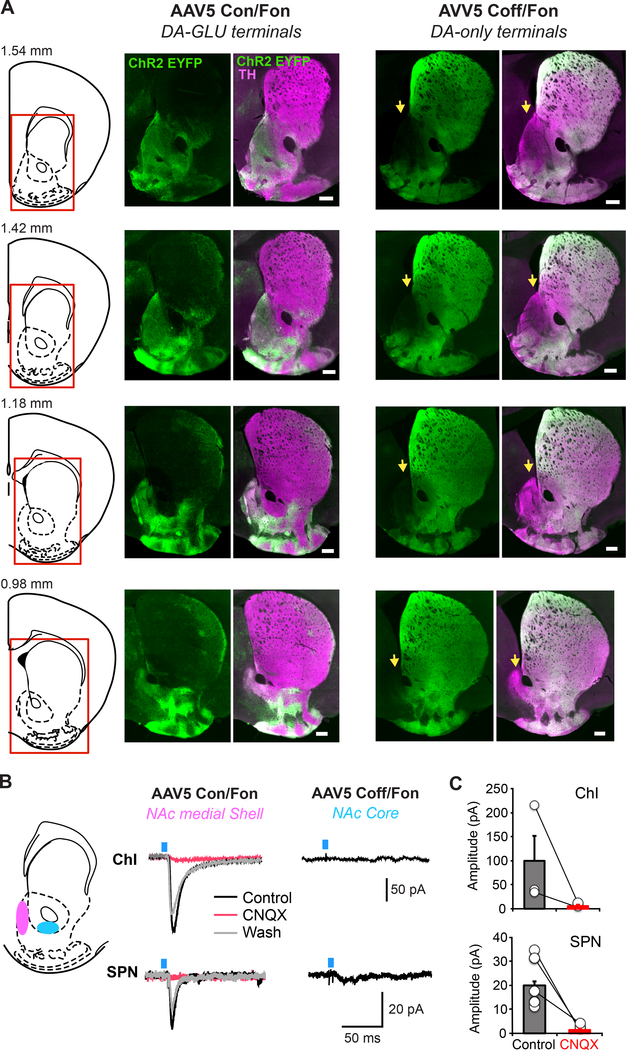
Figure 3 – Projections of DA-GLU and DA-only neurons to the Striatum.
A. Photomicrographs of the striatum taken at different anterior-posterior positions, showing distribution of DA terminals labeled with ChR2-EYFP driven by either INTRSECT AAV5 Con/Fon (DA-GLU neurons; left panels) or Coff/Fon (DA-only neurons; right panels) in the NAc. Numbers above the schematic coronal slices (left) indicate distance from bregma. Areas in the NAc medial dorsal Shell lacking DA-only labeled terminals are indicated by yellow arrows. B. Schematic of a coronal section (1.42 mm from bregma) indicating locations of patch-clamp recordings in the NAc medial Shell (pink) and NAc Core (blue) (left). Representative traces of EPSCs generated by single-pulse photostimulation (blue bar) at 0.1 Hz recorded from ChIs and SPNs are shown. Traces are averages of 10 consecutive recordings. EPSCs were observed when photostimulating DA terminals labeled by Con/Fon virus and recording in the NAc medial Shell. Responses were blocked by bath application of the AMPA receptor antagonist CNQX (40 0μM, red trace; wash, gray trace). EPSCs were not seen when photostimulating DA terminals labeled by Coff/Fon virus. ince the medial Shell lacks DA-only neuron terminals, DA-only neuron terminal stimulation and recording was done in the NAc Core. C. Summary of average EPSC amplitudes in ChIs and SPNs, before and after CNQX in mice injected with the Con/Fon virus is shown. These results are original data that have not been previously published.

