. 2019 Aug 6;10(39):9028–9037. doi: 10.1039/c9sc02287b

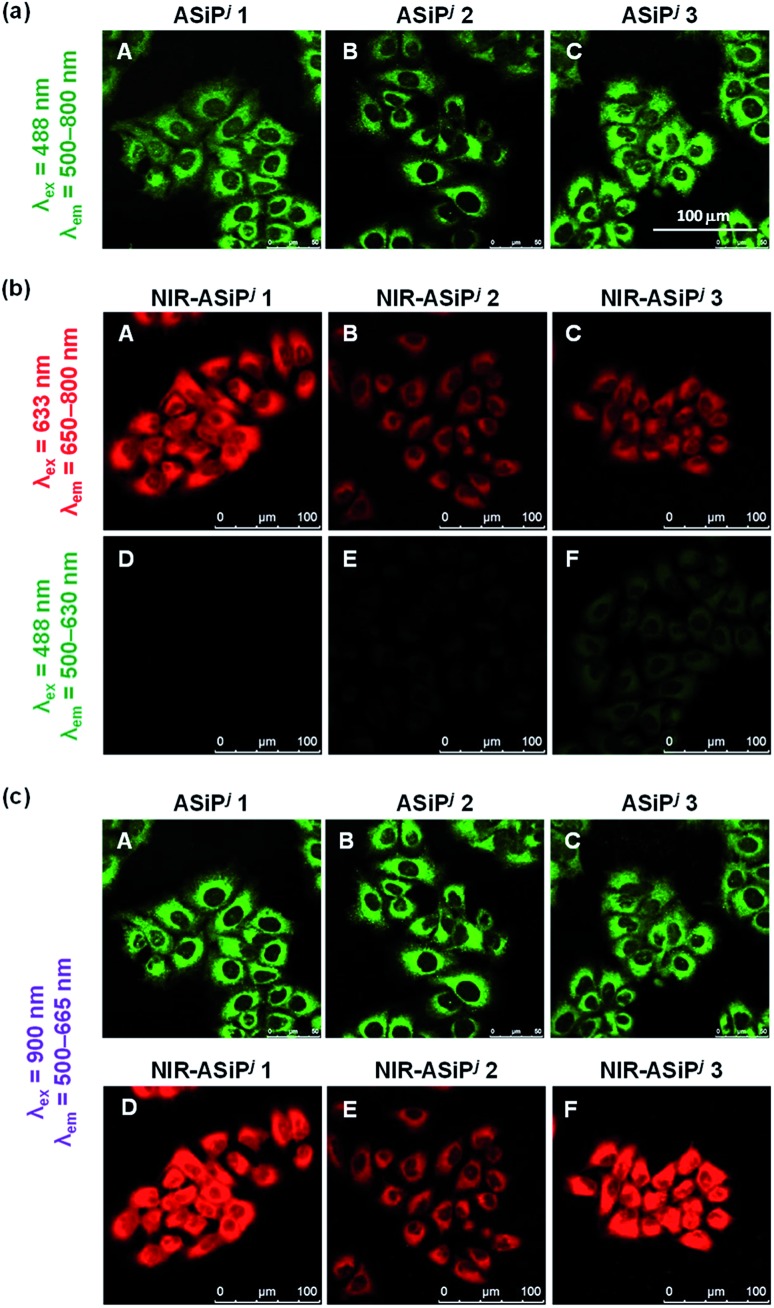
Fig. 4. (a) CLSM images of A549 cells incubated with ASiPj dyes (1.0 μM) for 30 min. The images were obtained by excitation at 488 nm and collection of the emissions in the range of 500–800 nm. (b) CLSM images of A549 cells incubated with NIR-ASiPj dyes (10 μM) for 30 min. The images were obtained by collecting emissions either from (A–C) the NIR channel (650–800 nm) under excitation at 633 nm or from (D–F) the green channel (500–630 nm) under excitation at 488 nm. (c) TPM images of ASiPj (A–C) and NIR-ASiPj (D–F) dyes. The images were obtained by excitation at 900 nm and collection of the emissions in the range of 500–665 nm. Scale bar: 100 μm.

Fig. 4