FIGURE 3.

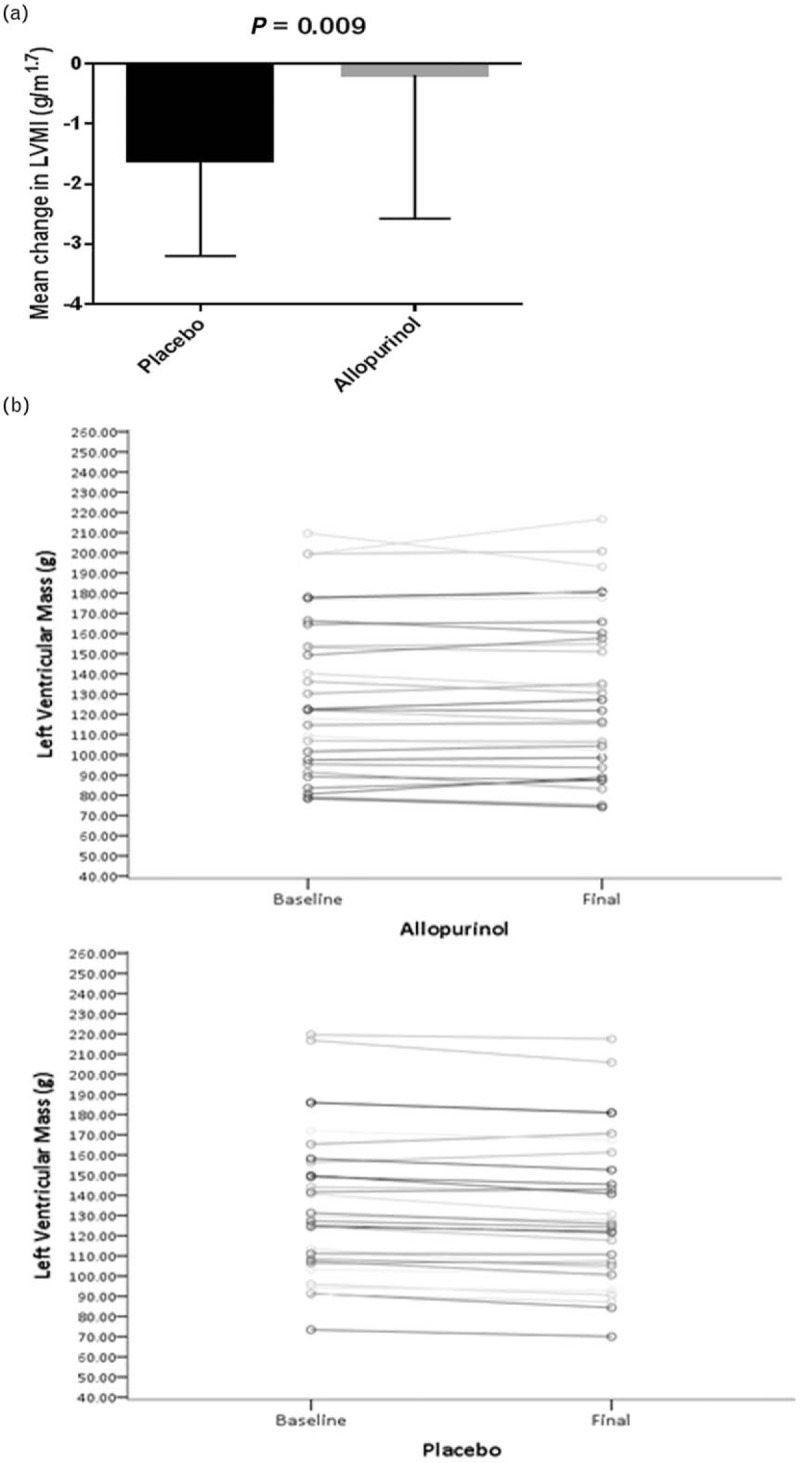
(a) The effect of allopurinol on left ventricular mass index (height1.7). Data expressed as mean ± SD. (b) The effect of allopurinol on left ventricular mass.

(a) The effect of allopurinol on left ventricular mass index (height1.7). Data expressed as mean ± SD. (b) The effect of allopurinol on left ventricular mass.