FIGURE 1.

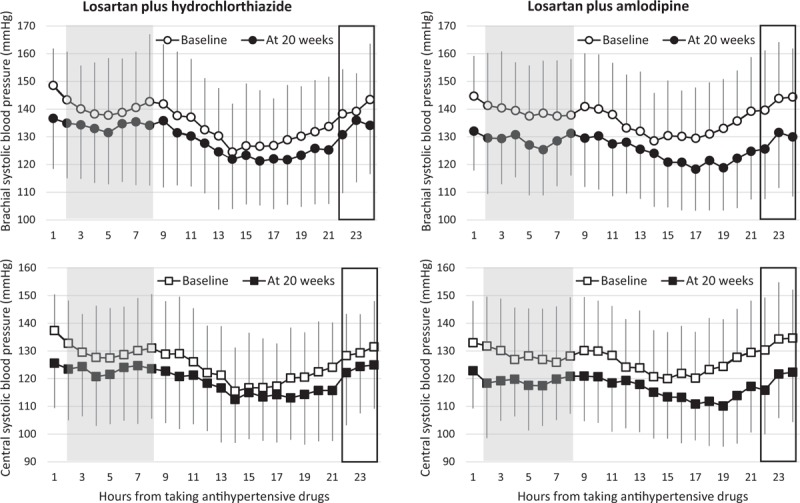
Brachial SBP profiles (upper) and central systolic blood pressure profiles (lower) at baseline and at week 20. Shaded area is the period to find peak efficacy of treatment and period with rectangle is to find trough efficacy of treatment.

Brachial SBP profiles (upper) and central systolic blood pressure profiles (lower) at baseline and at week 20. Shaded area is the period to find peak efficacy of treatment and period with rectangle is to find trough efficacy of treatment.