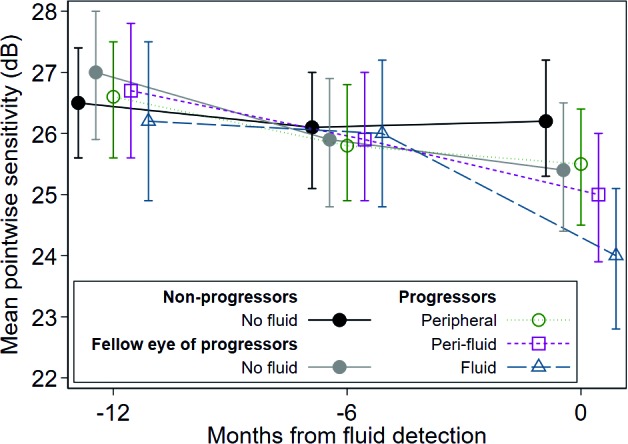
Figure 3.

Mean pointwise sensitivity estimated using a mixed-effects piecewise linear regression model with random intercepts, accounting for correlation within eye, participant and stimulus location, and adjusted for age and smoking status. Note the greatest decrease in sensitivity demonstrated by areas overlying fluid at time of fluid detection. Error bars indicate 95%CI. See Table 3 for statistical analysis. Note that individual data points have a slight spread at the three longitudinal time points so that each data point is visible. All data points were obtained at the time of fluid detection and at 6 and 12 months prior.
