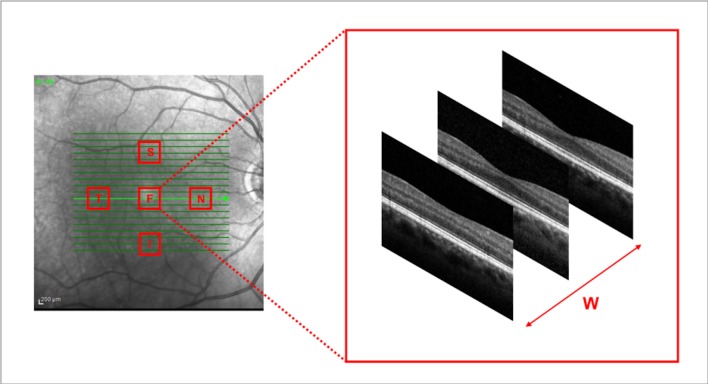
Figure 1.
Representation of the regions of interest used to investigate photoreceptor volume changes. OCT variables were investigated in five square regions of interest with dimension of 0.75 × 0.75 mm. The foveal region was centered on the fovea. The perifoveal regions (superior – S, nasal – N, inferior – I, and temporal – T) were placed at 1.0 mm from the foveal region. Each region of interest comprised three consecutive horizontal OCT B-scans. Photoreceptor EZ and OS volumes were thus investigated using formulas, which take into account the width (W) occupied by three consecutive B-scans.

