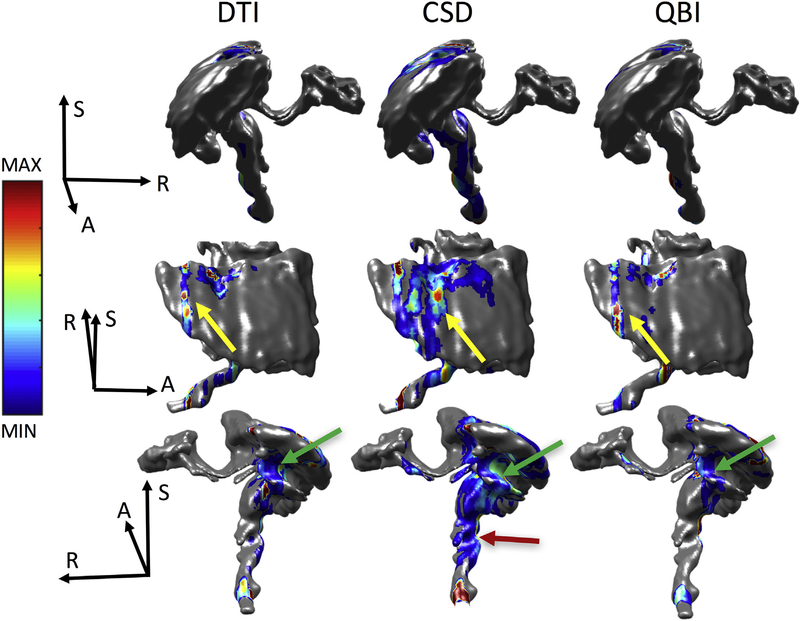
Fig. 11.
Where tractography goes wrong. Density maps overlaid on the BDA fiber mask indicating where tractography first exits the BDA mask are shown for DTI (left), CSD (middle), and QBI (right), in three different orientations. Note that for the B&S algorithm, streamline outputs are not given, so we cannot query where error occurs. Results for subject #2 are given as Supplementary Fig. 3. Error density maps are scaled individually from maximum to minimum error (see colorbar) where gray indicates no streamline error.

