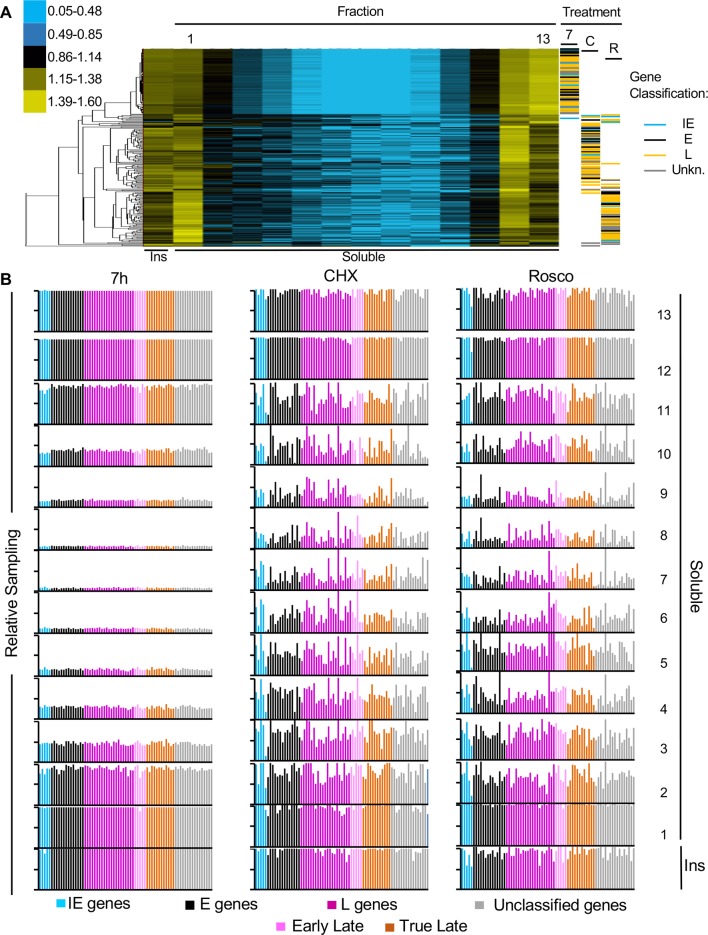
Fig 4. All HSV-1 genes resolved together to the least and most accessible chromatin fractions.
(A) Cluster analyses of the number of DNA reads for IE, E or L genes in each fraction. Cluster analysis was performed with Cluster 3.0 from Stanford University, visualized with Java Treeview. Color key on the left indicates ratio of reads in fraction over reads in the total DNA (ranges are in log2). 7, 7 hpi, untreated infections; C, CHX- treated infections (7 hpi); R, roscovitine-treated infections (7 hpi). (B) Gene sampling of each HSV-1 gene in each fraction. Sampling of each HSV-1 gene was calculated and normalized to the sampling of the same gene in the undigested and unfractionated chromatin. Each gene is color coded according to kinetic class. Blue, IE genes; black, E genes; dark purple, unclassified L genes; light purple, early L genes; brown, true L genes; grey, unclassified genes. Ins, insoluble chromatin fraction. Results from one experiment representative of three.

