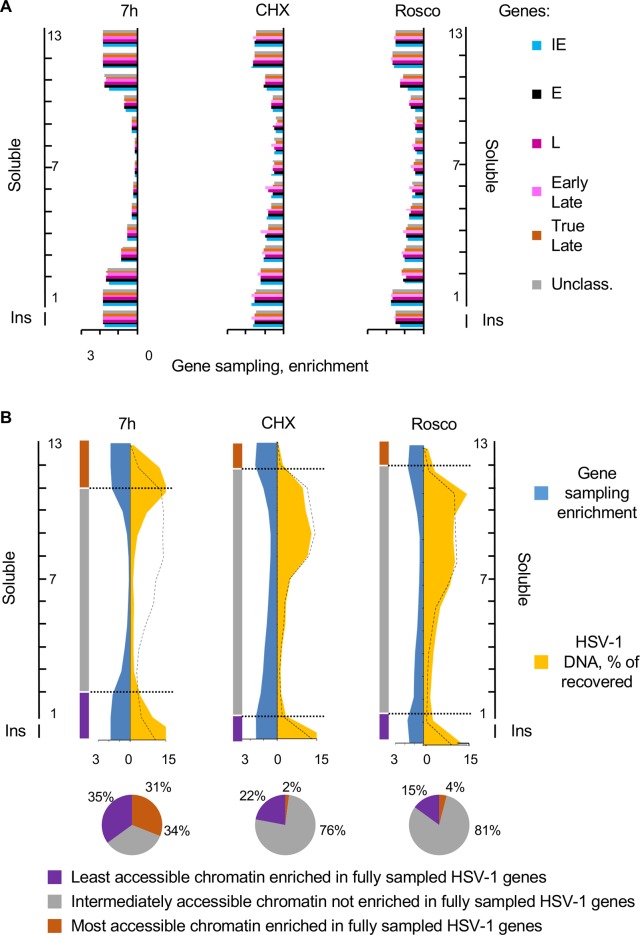
Fig 5. The most and least accessible chromatin enriched in fully sampled HSV-1 genes contained more HSV-1 DNA when transcription was active.
(A) Bar graphs showing average sampling of all genes in each HSV-1 gene kinetic groups in each fraction. Sampling of each HSV-1 gene was calculated and normalized to the sampling of the same gene in the undigested and unfractionated chromatin. The normalized sampling of all genes in each group was then averaged. Blue, IE genes; black, E genes; dark purple, unclassified L genes; light purple, early L genes; brown, true L genes; grey, unclassified genes. (B) Area graphs and pie charts presenting relative enrichment in gene sampling and percentage of HSV-1 DNA in each fraction. Gene sampling in each fraction is expressed as ratio to the average sampling to present the relative enrichment in fully sampled genes in each fraction. The distribution of the cellular chromatin is indicated by the dotted black line. Pie charts indicating the percentages of the HSV-1 DNA in the most accessible chromatin fractions containing completely sampled HSV-1 genes (brown), in the intermediate accessible chromatin fractions containing random samplings of each gene (grey), or in the least accessible chromatin fractions containing completely sampled HSV-1 genes (purple). Ins, insoluble chromatin fraction. Results from one experiment representative of three.

