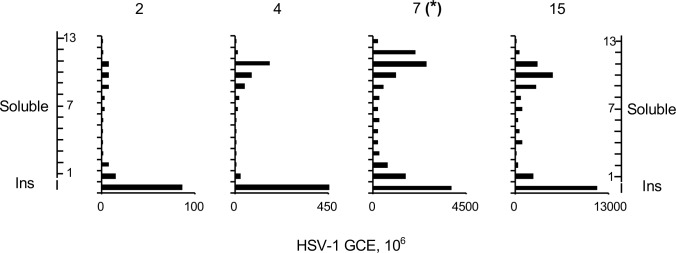
Fig 6. Differential fractionation of HSV-1 DNA throughout infection.
Bar graphs showing HSV-1 genome copy equivalents in each fraction. (*) Data from Fig 2 presented again for comparison. Ins, insoluble chromatin fraction; GCE, genome copy equivalent. Results from one experiment representative of two.

