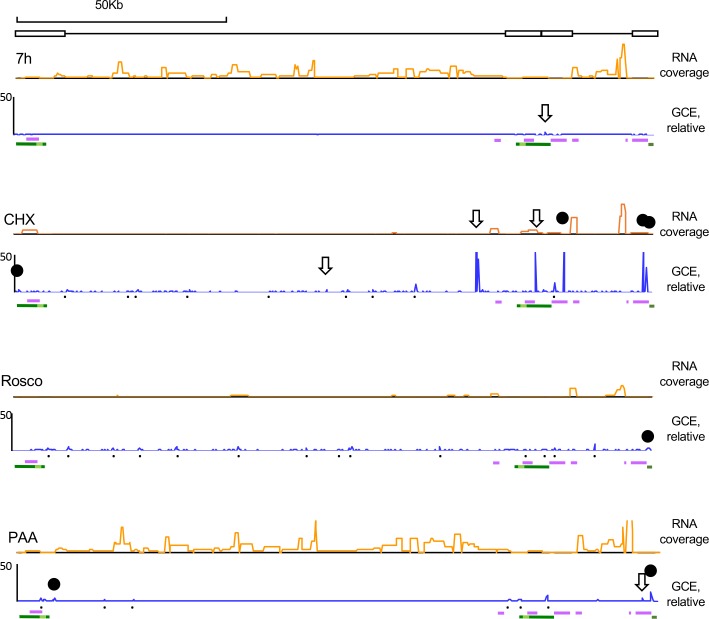
Fig 9. No HSV-1 loci fractionated differently regardless of transcription levels, but short overrepresented sequences flanked transcribed genes when transcription was restricted.
Line graphs showing HSV-1 number of genome copy equivalents (GCE) in each genome position in untreated infections, or in infections treated with CHX, Rosco, or PAA at 7 hpi, normalized to the number of HSV-1 genome copy equivalents in the respective position of undigested and unfractionated chromatin (blue line). Orange line graphs, HSV-1 RNA reads. X-axes, genome position (cartoon on top). Black downward empty arrows, CTCF binding sites in strain 17; black solid circles, chromatin insulator-like elements in strain 17; black dots, other overrepresented sequences; purple bars underneath genome plots, IE genes; dark green bars underneath genome plots, LAT; light green bar, stable LAT; GCE, genome copy equivalent. Results from one experiment representative of three.

