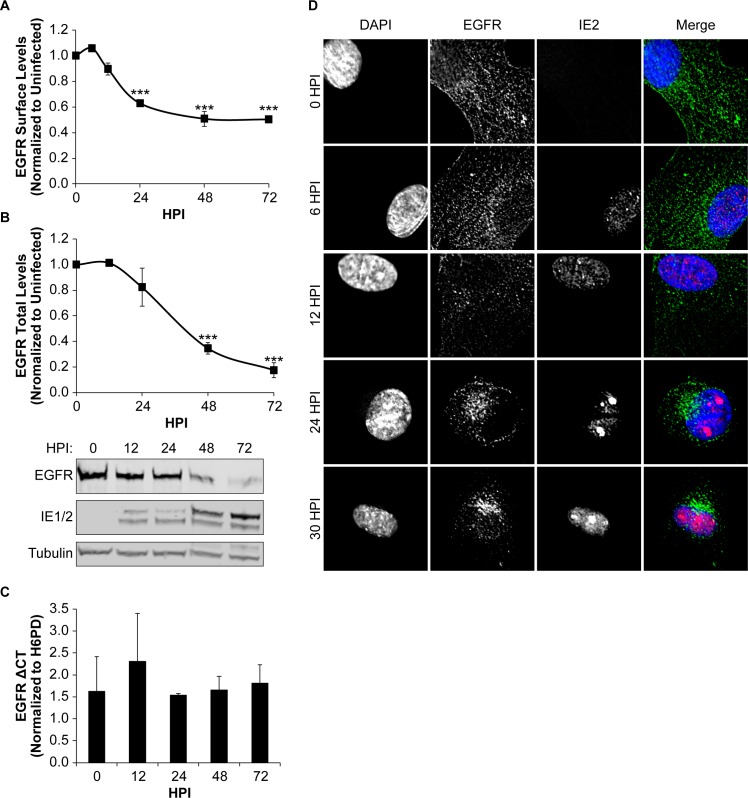
Fig 1. CMV downregulates EGFR surface and total protein levels as infection progresses.
Fibroblasts were infected with TB40/EGFP virus at an MOI of 1 for 0–72 hpi, with 0 hpi being uninfected. (A) To measure EGFR surface levels, infected cells were stained with brilliant violet 421 conjugated α-EGFR antibody and analyzed by flow cytometry. Normalized geometric mean fluorescent intensity is shown. (B) Total EGFR levels were measured over a time course by immunoblotting. Blots were stained with α-EGFR, α-IE1/2 antibody, and α-Tubulin. Both surface (A) and total (B) EGFR levels were normalized to 0 hpi for statistical analysis. IE proteins serve as a control for infection and tubulin serves as a control for loading. (C) Relative EGFR mRNA levels were measured over a time course using quantitative reverse transcriptase PCR and SYBR green. EGFR transcripts are normalized to H6PD, cellular housekeeping control, at each timepoint. (A-C) Statistical significance was calculated by One-Way ANOVA with Tukey’s correction and represented by asterisks (*** p-values < 0.001). Graphs represent the means from 3 independent replicates with error bars representing SEM. (D) Subcellular localization of EGFR was monitored over a time course of infection. Nuclei, EGFR and IE2 are visualized by staining with DAPI, α-EGFR, and α-IE2 and confocal deconvolution microscopy.

