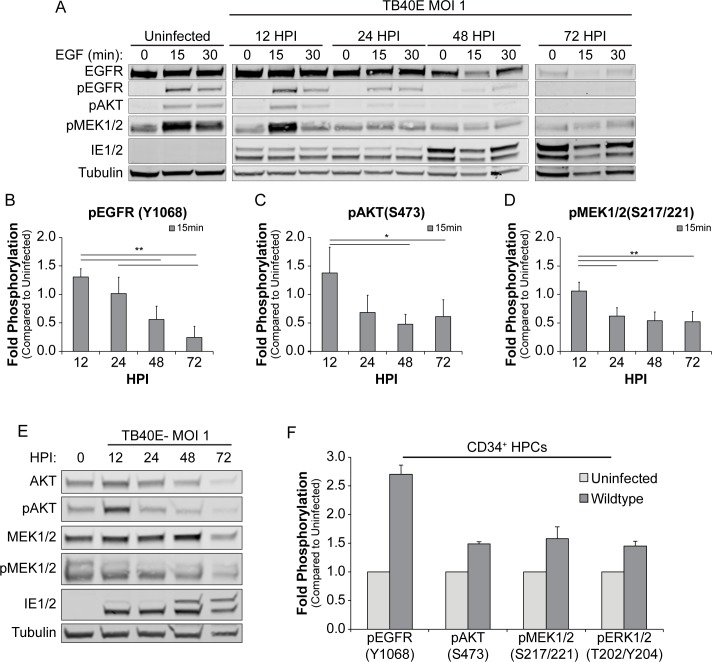
Fig 2. CMV infection prevents activation of AKT and MEK1/2.
(A) Fibroblasts were serum starved for 24h and cells were then infected for 0–72 hpi. At each timepoint, infected cells were pulsed with 10 nM of EGF for 0–30 min, and lysed. Lysates were separated out on SDS-PAGE gel, transferred on PVDF membrane, and stained for α-EGFR, α-pEGFR (Y1068), α-pAKT (S472), α-pMEK1/2 (S217/221), α-IE1/2 antibody, and α-Tubulin. (B) The 15 min post EGF timepoint for all phosphorylation markers were normalized to uninfected cells and graphed to calculate statistics. Statistical significance was calculated by One-Way ANOVA with Tukey’s correction and represented by asterisks (* p-value < 0.05 and ** p-value < 0.01).Graphs represent the mean of three replicates and error bars represent SEM. (E) Lysates from the 15 min post EGF-pulse at each time point post infection was separated by SDS-PAGE, transferred on PVDF membrane, and stained for α-AKT, α-pAKT(S472), α-MEK1/2, α-pMEK1/2(S217/221), α-IE1/2 antibody, and α-Tubulin to analyze total levels of AKT and MEK1/2. (F) CD34+ cells uninfected or infected with WT CMV (MOI of 2) were fixed and permabilized at 48 hpi. Cells were stained with PE conjugated α-CD34+, Alexa Fluor 350 conjugated α-pEGFR(y1068), Dylight 649 conjugated α-pAKT(S473), Alexa Fluor 647 conjugated pMEK1/2(S217/221), and PerCP-eFluor 710 conjugated pERK1/2(T202/Y204) and the geometric mean of fluorescence determined by flow cytometry. Bars represent the average fold change in the geometric means from two replicates. Error bars represent the range of the two replicates.

