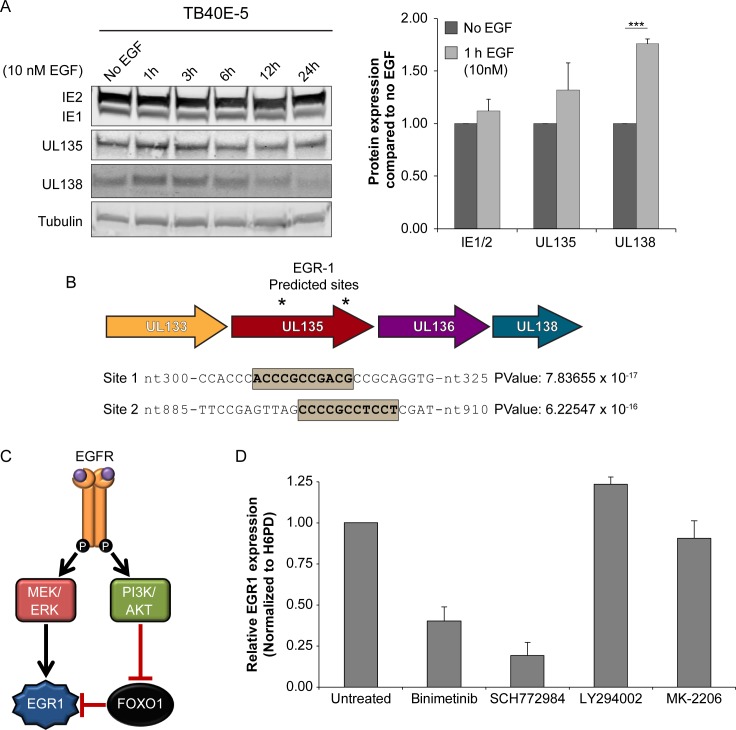
Fig 4. EGFR signaling promotes UL138 protein accumulation.
(A) Fibroblasts were infected with TB40/EGFP (MOI = 1) and put into serum-free media at 24hpi. Cells were stimulated with 10nM EGF at 48 hpi and cells were harvested between 1 and 24 hours post stimulation. Lysates were separated by SDS-PAGE, transferred and blotted with α- IE1/2, α-UL135, α-UL138, and α Tubulin. Protein levels from 4 replicates were normalized to no EGF treated control and 1h post EGF treatment is graphed. Statistical significance was calculated by student t-test; asterisks *** p-value < 0.001. Error bars represent SEM.(B) Graphical representation of putative EGR1 binding sites located within UL135 ORF starting at nt-306 and nt-896, in reference to UL135 start codon. P-values were calculated using PhysBinder prediction software. (C) A model depicting how EGFR signaling promotes EGR1 expression by either directing its expression through MEK/ERK signaling or by blocking FOXO1 suppression of EGR1 transcription though PI3K/AKT signaling. (D) CD34+ HPCs were infected with WT virus (MOI of 2) and treated with MEK/ERK (Binimetinib and SCH772984) or PI3K/AKT (LY294002 and MK-2206) inhibitors at 4 hpi. RNA was isolated at 48 hpi EGR1 measured by RT-qPCR relative to H6PD. Graph represents the average from two replicates with error bars that represent the range.

