
Fig 1. Cortical activity across the sleep-wake cycle is characterized by intermittent irregular transitions between brain rhythms with dominant spectral power.
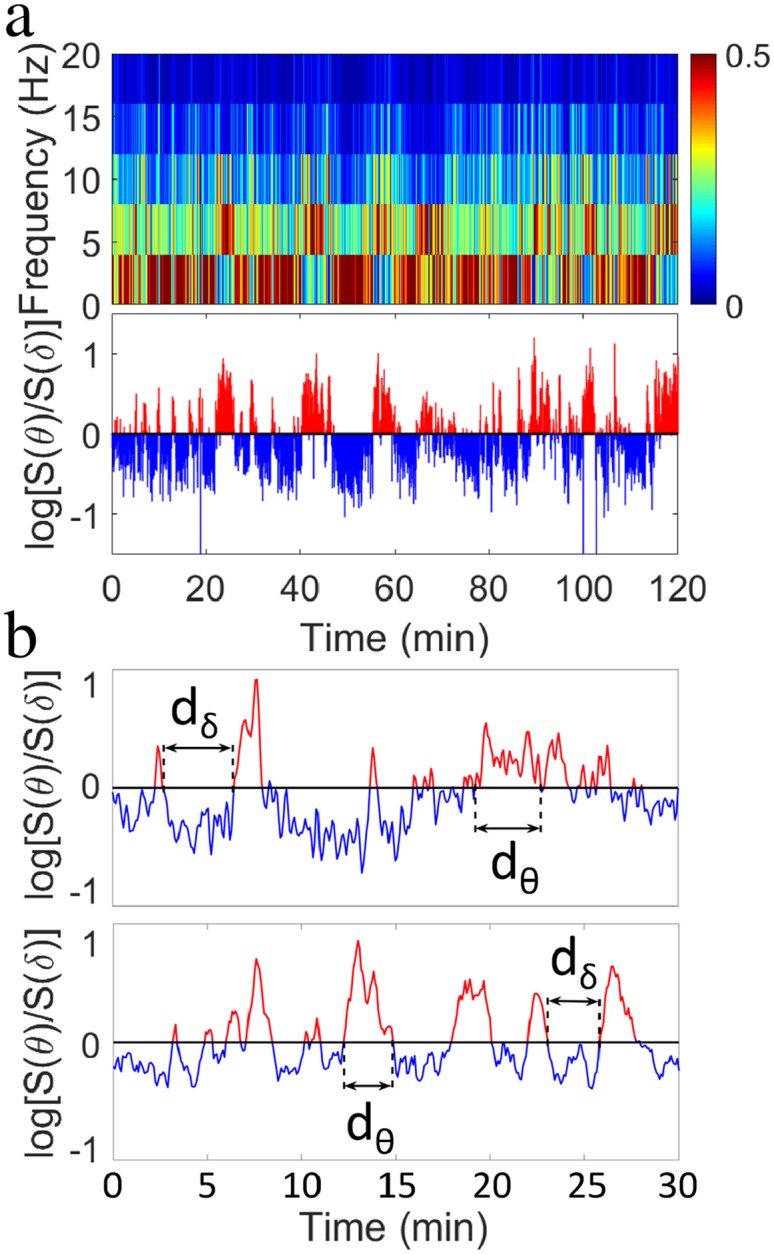
(a) (Top panel) Spectrogram obtained from cortical EEG signal of a control group rat over a 2 h segment of 12-hour lights-on period (when rats predominantly sleep). Spectral power is calculated in non-overlapping time windows w = 5 s, and is color coded over a range (0-20 Hz) of physiologically-relevant frequencies. Segments in red indicate bursts of prominent activity in the low frequency band (0-4 Hz, corresponding to δ waves) and intermediate frequency band (4-8 Hz, corresponding to θ waves). (Bottom panel) Ratio Rθδ = S(θ)/S(δ) of the spectral power in the θ and δ band in logarithmic scale obtained for each window w from the spectrogram shown in top panel. Values Rθδ above a threshold Th = 0 indicate predominance of θ rhythm (in red), while values below the threshold Th = 0 correspond to predominance of δ rhythm (in blue). (b) Smoothed ratio Rθδ of the spectral power in the θ and δ band during a 30 min segment of 12-hour dark (lights-off) period for a control rat (top panel) and a PZ-lesioned rat (bottom panel). Rθδ is calculated in non-overlapping windows w = 5 s; smoothing is performed using a 5 point moving average. θ- and δ-bursts are defined as sequences of consecutive windows w where either the power in θ or δ band is dominant.