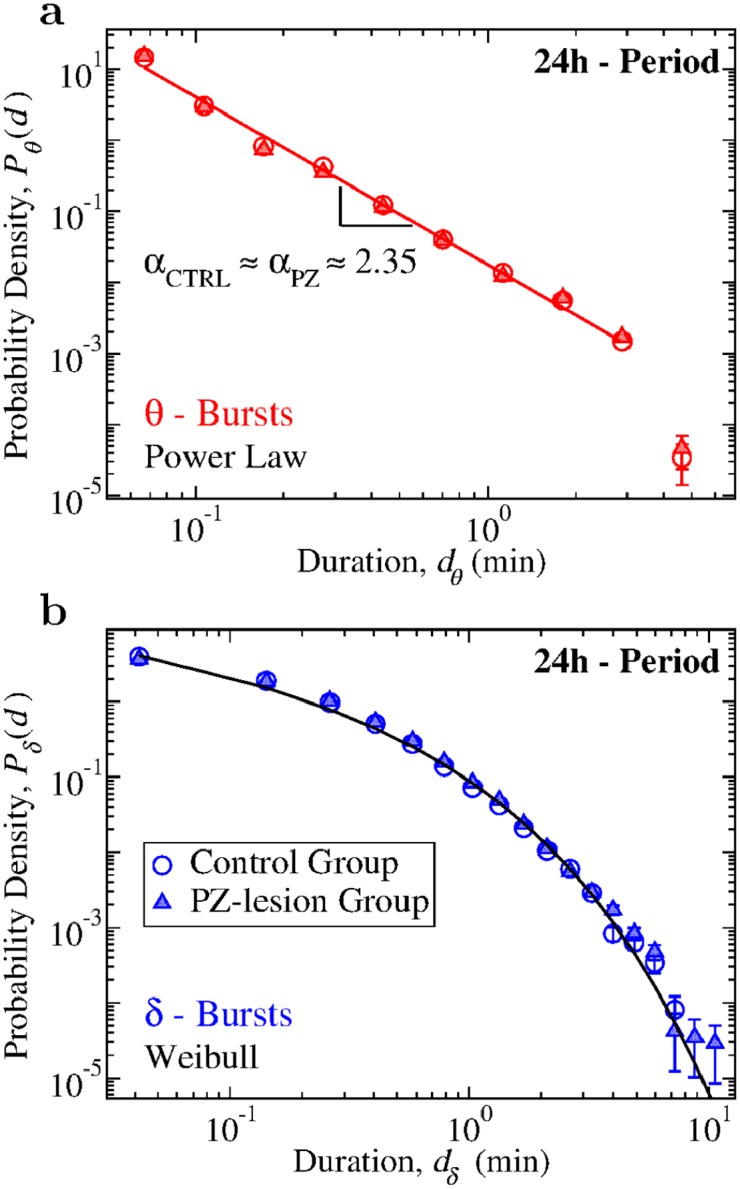
Fig 2. Durations of θ- and δ-bursts across the 24 h sleep-wake cycle follow distinct statistics that are robust, do not change with lesion of the PZ neurons, and are typical for non-equilibrium systems at criticality.

(a) Probability density distribution of θ-burst durations for control (open circles) and PZ-lesioned rats (full triangles) over the 24 h period (pooled data). The distribution exhibits a power-law behavior in both groups (red tick line), with exponent αctrl = 2.34 ± 0.06 for control rats and αPZ = 2.31 ± 0.07 for PZ. The power-law exponent value for control and PZ rats do not show significant difference (t-test, p > 0.99). Lesion of the PZ area does not cause significant variations in the power-law exponent α, indicating a robust scale-invariant temporal organization of θ-bursts. (b) Probability density of δ-burst durations for control and PZ-lesioned rats over 24 h period (pooled data). In contrast to the statistics of θ-bursts, δ-bursts durations follow a Weibull distribution (stretched exponential tail with a characteristic time scale, Eq 2). Parameters of the Weibull functional form are not significantly affected by lesion of the PZ (βctrl = 0.59, λctrl = 0.16; βPZ = 0.54, λPZ = 0.13). Black line is a Weibull fit of the distribution for control rats. All durations are calculated using window size w = 5 s for the spectrogram and threshold Th = 1 on the ratio Rθδ (Fig 1). Error bars are calculated for each value and where not shown are smaller than the symbol size. Error bars calculation and binning procedure are described in Materials and methods, Data analysis.
