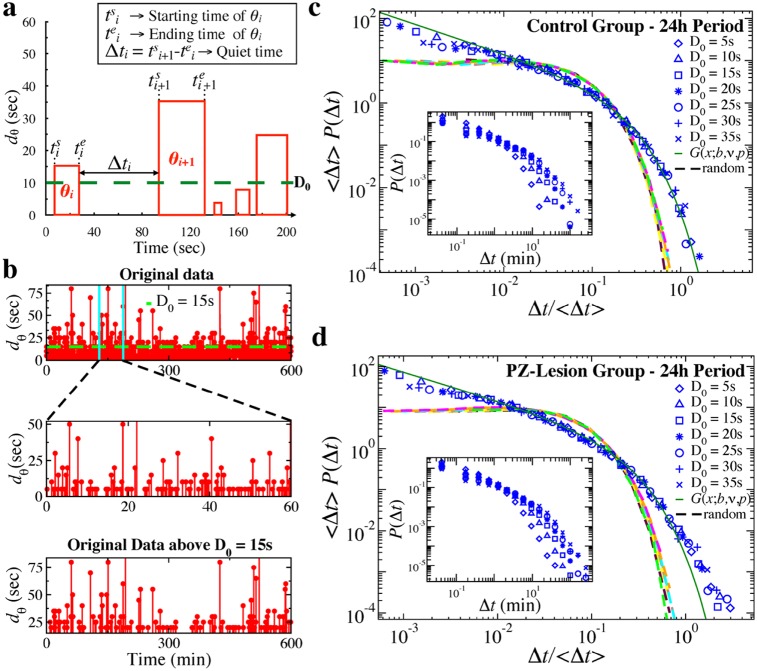
Fig 6. Self-similar structure in quiet times between consecutive θ-bursts indicates coupling between time of occurrence and burst duration.
(a) Schematic diagram of quiet time Δt between consecutive θ-bursts. A quiet time Δti is the time elapsed from the end of burst θi to the beginning of the following burst θi+1. (b) Top: Time series of θ-burst durations for about 600 min recording of a control rat. Middle: A 60 min segment from the sequence shown in top panel. Bottom: Sequence comprised only of the θ-burst durations longer than D0 = 15 s that are present in the 600 min time series shown in the top panel. Selecting only bursts longer than D0 = 15 s, the temporal pattern at the scale of 600 min looks similar to pattern at smaller scale of 60 min, indicating self-similar structure in quiet times. (c) Distribution of quiet times for different thresholds D0 on θ-burst durations over a 24 h period in control rats (blue symbols). When rescaled by 〈Δt〉 (main panel), distributions obtained for different D0 collapse onto a unique function that is well described by a generalized Gamma distribution G(x; b, ν, p) (solid green line), with b = 0.15, ν = 0.31, and p = 0.91. Applying the same procedure to a sequence of randomly reshuffled θ-burst durations, thus eliminating information about the timing of θ-bursts, leads to distributions that collapse onto an exponential function (dashed lines). Inset: Distributions of quiet times for different thresholds D0 before rescaling. (d) Distributions of quiet times for different thresholds D0 on θ-burst durations over a 24 h period in PZ-lesioned rats. Distributions collapse onto a unique function when rescaled by 〈Δt〉 (main panel). Similar to control rats, this function is well described by a generalized Gamma function G(x; b, ν, p) (solid green line), with b = 0.17, ν = 0.24, and p = 0.83. Distribution of quiet times obtained from a sequence of randomly reshuffled θ-burst durations collapse onto an exponential distribution (dashed lines). Insets: Distributions of quiet times in PZ-lesioned rats for different thresholds D0 before rescaling. Results are consistent when considering separately light and dark periods (Fig F in S1 File).

