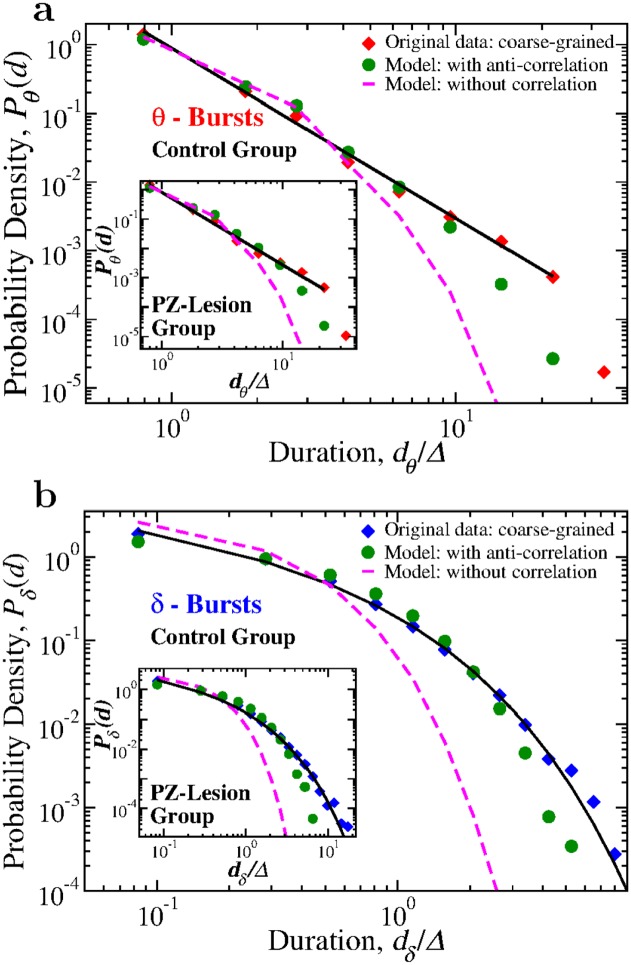
Fig 10. Anti-correlations between consecutive θ- and δ-bursts durations are essential for emerging critical behavior with duality of power-law and Weibull dynamics.
Probability distributions of θ- and δ-burst durations from 24 h control and PZ-lesioned rat data coarse-grained (CG) over a window Δ = 10 s, are compared with the distributions obtained from the model-generated coarse-grained binary time series of θ- and δ-bursts durations with anti-correlations and without correlations (random pairing of θ- and δ-bursts, Fig 9). (a) Distributions Pθ(d) of θ-burst durations for: (i) 24 h control rats data (red diamonds), (ii) model-generated time series of θ- and δ-bursts durations with anti-correlations (green circles), and (iii) model-generated time series with random pairing of θ- and δ-bursts durations (magenta dashed line). Inset shows results from same analysis on Pθ(d) for the group of PZ-lesioned rats. (b) Distribution Pδ(d) of δ-burst durations for: (i) 24h control rats data (blue diamonds), (ii) model-generated time series with anti-correlations (green circles), and (iii) model-generated time series with random pairing of θ- and δ-bursts durations (magenta dashed line). Inset shows results from same analysis on Pδ(d) for the group of PZ-lesioned rats. In both (a) and (b), durations are in units of Δ, which is the window size used to coarse grain the sequences of θ- and δ-bursts durations. The distributions obtained from the model using anti-correlated dθ and dδ pairing (green circles) closely match the duration distributions for the original data (diamonds)—power law for Pθ(d) and Weibull for Pδ(d)—for both control and PZ-lesioned rats. In contrast, a random pairing of dθ and dδ produces duration distributions following the Poisson functional form (magenta dashed lines) that significantly deviates from the original data.

