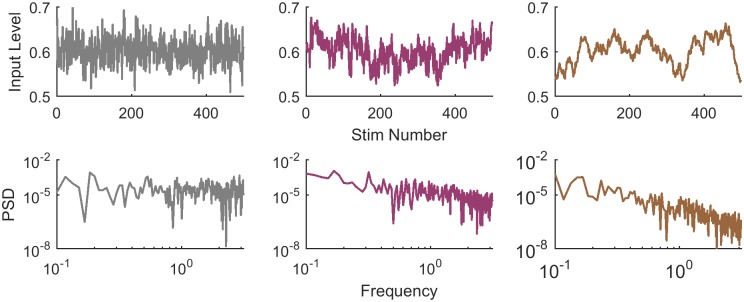
Fig 2. Temporal structure of stimuli.
Examples of input levels in their temporal order (top panels), and their corresponding power spectral densities (PSD, bottom panels), for the three types of stimuli used in the experiments. In the “White” stimulus (left; grey lines), consecutive input levels are independent and the PSD is flat. In the “Pink” stimulus (center; pink lines), consecutive input levels are correlated and the PSD decreases with frequency. The “Brown” session (right; brown lines) varies extremely slowly, consecutive input levels are highly correlated and the PSD decreases sharply.

