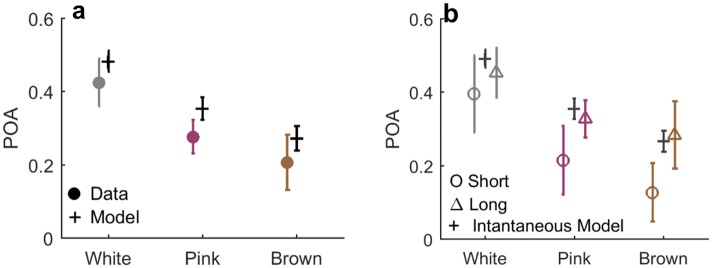
Fig 7. Repetitive bias quantified by Probability of Alternations (POA).
a) POA computed for human observers (filled circles) and for 15 instantaneous model observers (Black +’s). Means are [0.43,0.28,0.21] for the model and [0.49,0.35,0.27] for the data, for White, Pink and Brown inputs respectively. Errorbars: Standard Deviation. Two sided T-test was performed between the groups of values showed strong significant difference (p-values: 0.0007,<0.0001,0.01). b) POA strongly depends on response time in all stimulus regimes. Trials were separated to shorter and longer than median for each observer, and POA computed for each group separately. The slow trials (marked Δ’s) exhibit a POA similar to the bias-less observer (marked black +’s), while the fast trials (marked O’s) show a much stronger repetitive bias and are largely responsible for the average effect seen in a.

