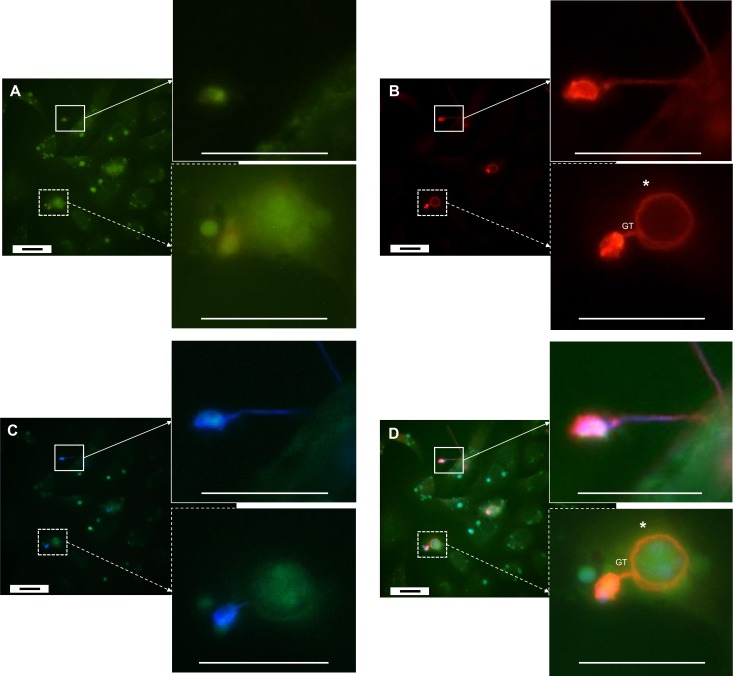
Fig 4. Epibiotic and endobiotic growth of Bd on and in A6 cells, 2 days p.i..
(A) Bd-exposed A6 cells were stained using a green cell tracker. (B) Bd was visualized using Alexa Fluor 568, resulting in red fluorescence of both intracellular and extracellular Bd. (C) The cell wall of extracellular Bd was coloured using Calcofluor White, showing blue fluorescence. The pictures were merged in (D). Two days after inoculation, both epibiotic and endobiotic growth were observed. Epibiotic growth can be described as development outside the host cell (squares with a full line), which stains Bd both blue and red. Endobiotic growth (squares with a dashed line) is visualized as a red staining of the intracellular chytrid thalli (*) at the end of the germ tube (GT). Scale bar = 20 μm.

