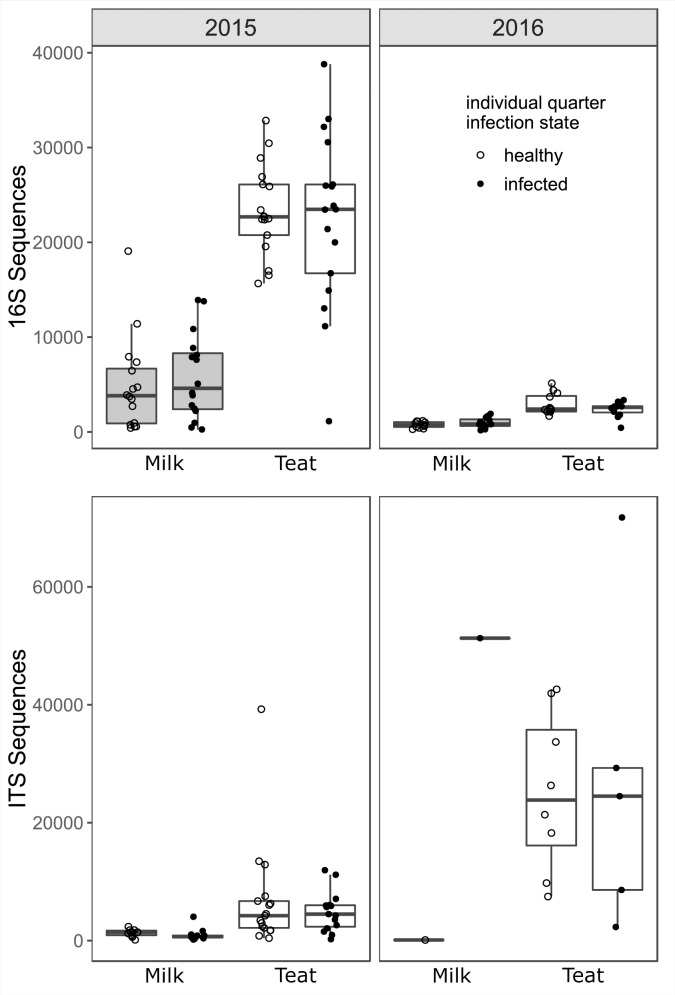
Fig 1. 16S and ITS rRNA gene amplicon sequence counts by year and habitat state.
Points represent gland samples prior to normalization. Upper plot: 16S rRNA sequences, n = 114. Sequence counts varied between years, median counts 2015 = 14484, median counts 2016 = 1752, p < 0.001). Lower plot: ITS sequence counts, n = 70. Note the difference in scale between the two plots.

