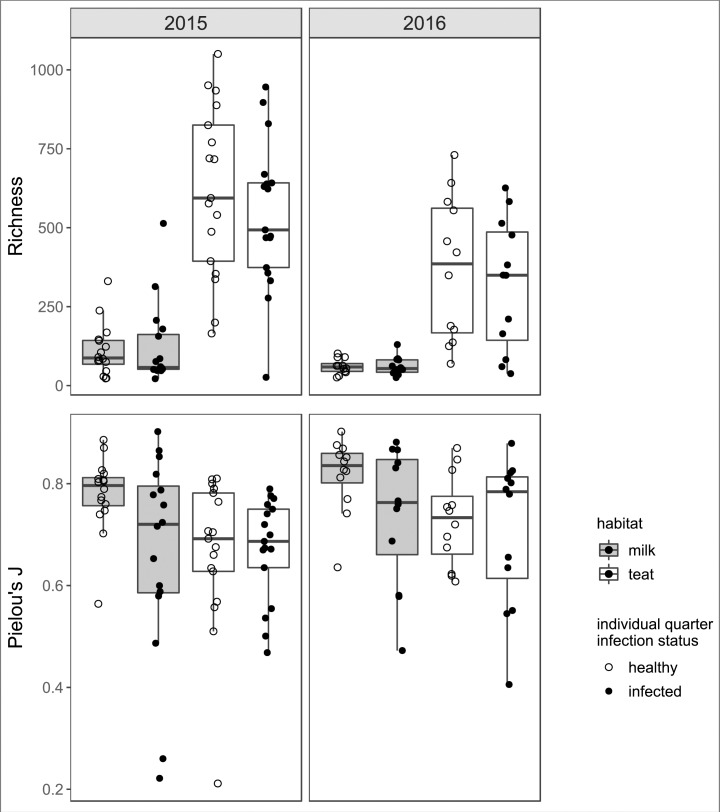
Fig 3. Bacterial OTU diversity as represented by richness and evenness of OTUs in each habitat state and year.
Richness was calculated as number of OTUs; evenness was measured using Pielou's J (J = Shannon/log(richness)). Index values closer to 1.0 indicate increasingly even distributions of OTU abundances.

