
Figure 3.
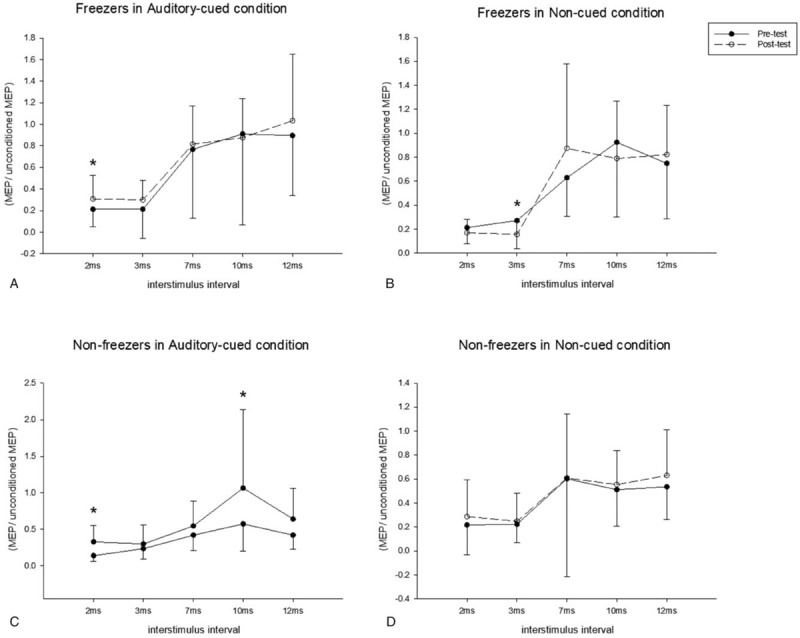
Pair-pulse transcranial magnetic stimulation in the freezer group (A and B) and nonfreezer group (C and D). The solid line represents the pretest and the dotted line represents the posttest results. A significant decrease was found at short intracortical inhibition (2 ms) in the freezers in the auditory-cued condition (A); a significant increase was found at short intracortical inhibition (3 ms) in the freezers in the non-cued condition (B); in the nonfreezers, increased excitation was found at at short intracortical inhibition (2 ms) and intracortical facilitation (10 ms) in the auditory-cued condition (C), and no difference was noted between the pretest and posttest in the non-cued condition (D). ∗P < .05.