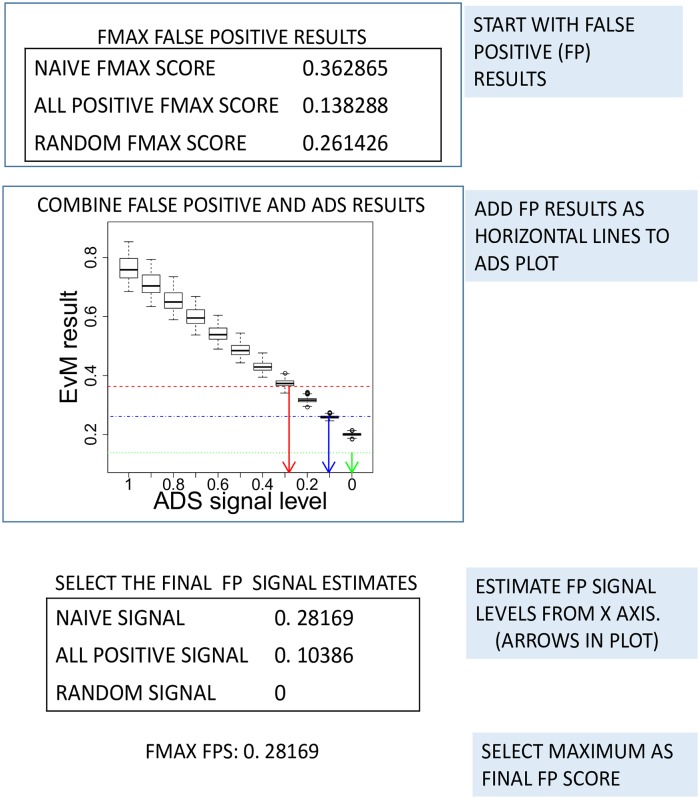
Fig 3. Combining FP sets with ADS results.
Here Fmax results from False Positive (FP) sets are combined with Fmax boxplots from ADS. FP results are added as horizontal lines to the visualisation. A robust metric would score FP sets near the lowest boxplot. An FP signal estimate is obtained by comparing each FP result with medians of each signal level. This is shown in figure with vertical arrows. Resulting signals are here limited to between 0 and 1.

