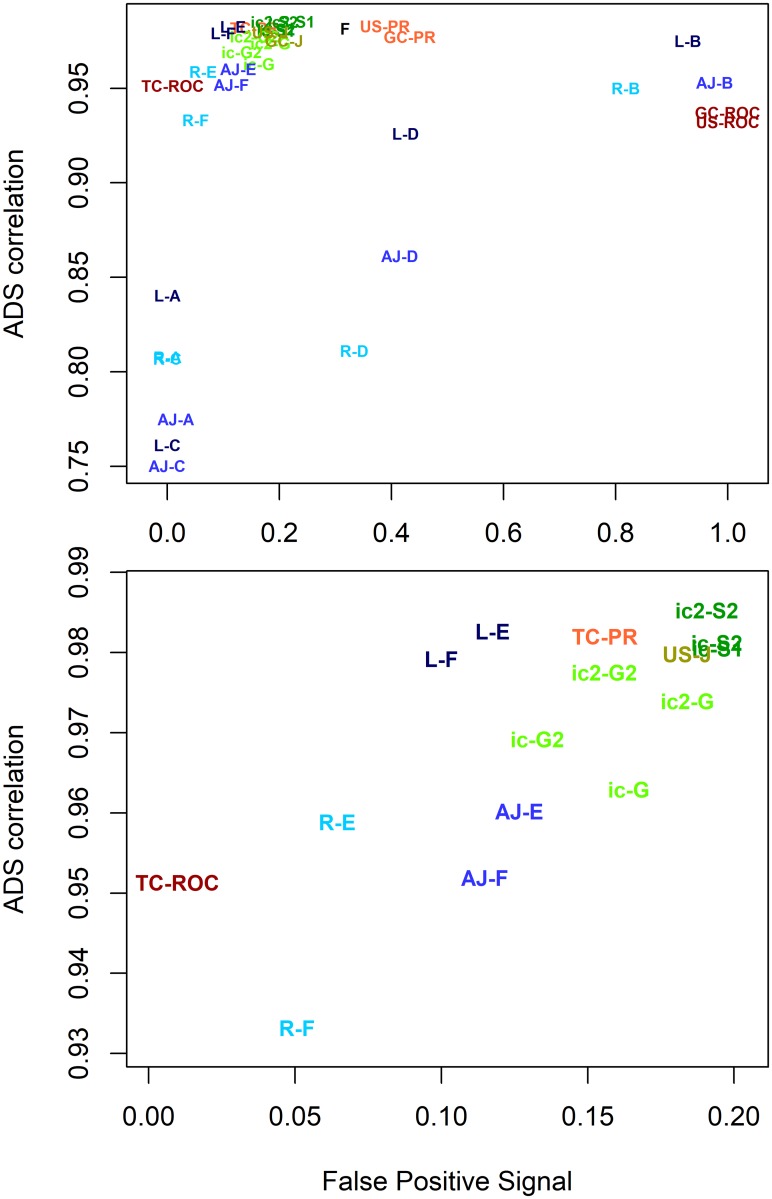
Fig 8. Top metrics for CAFA data set.
Metrics are shown with different colours. Fmax is black, AUC-ROC and AUC-PR are in red, Jacc, Smin and SimGIC are in green and semantic similarity metrics are in blue. Colours are varied between different metrics in the same group. The figure uses the following abbreviations: AJ = AJacc, F = Fmax, G = SimGIC, J = Jacc, L = Lin, PR = AUC-PR, R = Resnik, ROC = AUC-ROC and Sm = Smin. Abbreviations are combined with summation or data structuring method. For example, Resnik F is R-F, Lin A is L-A, TC AUCROC is TC-ROC, ic2 SimGIC is ic2-G and ic Smin is ic-S. High quality metrics appear in the upper left corner (high correlation and low False Positive Signal). This clustered part is zoomed in the lower panel for clarity.

