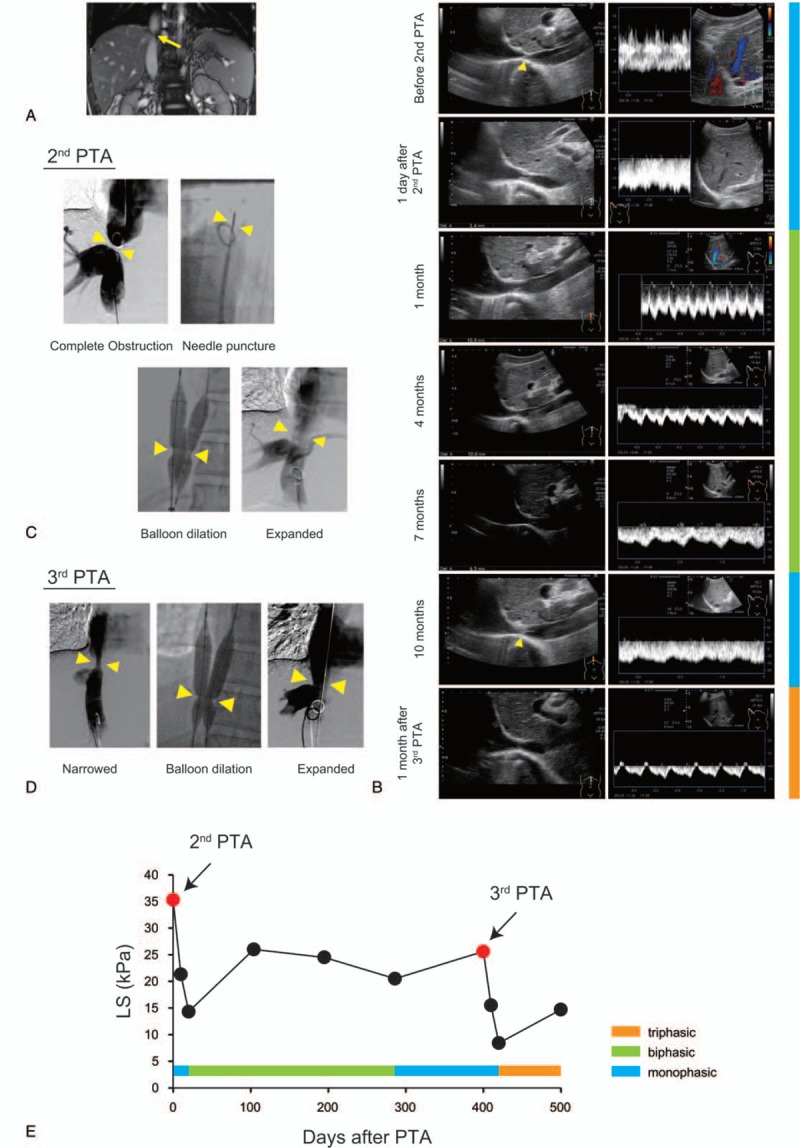
Figure 2.

Changes in the HV waveform and LS value in case 2. (A) Enhanced MRI showed severe stenosis of the IVC (arrow). (B) Ultrasound images of the IVC and waveform of the RHV before and after PTA. Before the second PTA, a membranous structure was detected in the IVC (arrow) and the HV waveform was monophasic. One day after PTA, the IVC had opened slightly while the HV waveform remained monophasic. One month later, the IVC had expanded to 11 mm and a biphasic waveform was detected, which was maintained for 7 months. Ten months after the second PTA, the IVC had narrowed to 4.7 mm, the HV waveform exhibited a monophasic pattern, and a highly echoic structure was present in the IVC (arrow). After the third PTA, the IVC had expanded to 12.6 mm and the HV waveform was triphasic. (C) X-ray venography during the second PTA. The completely occluded IVC was expanded by 14-gauge needle puncture followed by balloon dilation. (D) X-ray venography during the third PTA; the narrowed IVC was expanded by balloon dilation. (E) Changes in the LS value and HV waveform pattern between before and after PTA. (R)HV = (right) hepatic vein, IVC = inferior vena cava, LS = liver stiffness, MRI = magnetic resonance imaging, PTA = percutaneous transluminal angiography.
