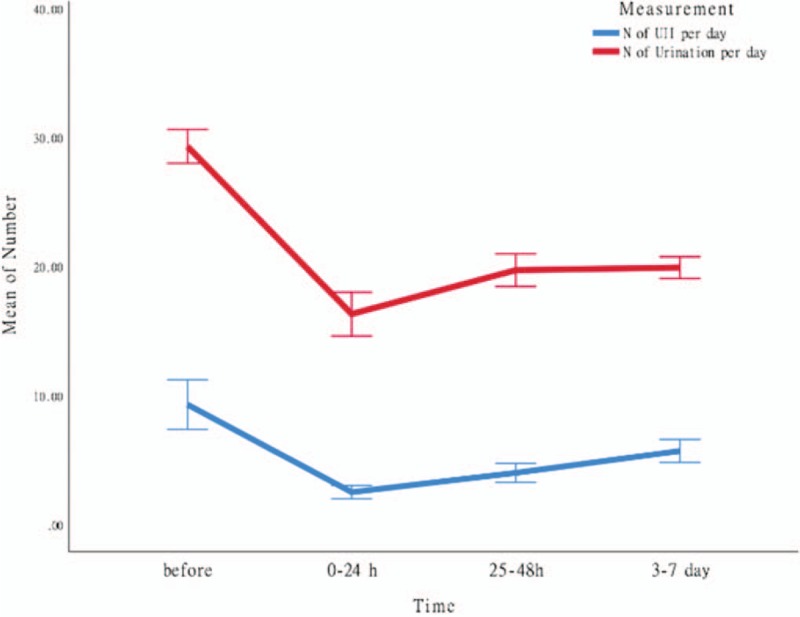
Figure 3.

Mean symptom levels in different stages of the treatment. The red line in the picture represents the average number of times of urination per day in a given period of time; the blue line represents the average number of times of urgent urinary incontinence per day in a given period of time; the ordinate coordinate represents the number of times of urination and urinary incontinence; and the abscissa represents the different periods of observation (a total of 4 periods of observation): the first period is before treatment. Five days; the second period is 0 to 24 hours after treatment; the third period is 25 to 48 hours after treatment; the fourth period is 3 to 7 days after treatment.) From the change trend of the 2 lines, it can be seen that the frequency of urination and urinary incontinence in 0 to 24 hours after treatment is significantly lower than that before treatment. With the prolongation of treatment time, the average number of urination per day and the average number of urgent urinary incontinence per day also gradually increased. N: number. UII: urinary incontinence.
