Abstract
The asymmetry in lower extremity strength is known to be related to the functional mobility in older adults living in the community. However, little is known about the association between lower extremity lean mass asymmetry and functional mobility in this patient group. Hence, this study aimed to determine whether asymmetry in lower extremity muscle mass has a significant relationship with functional mobility in older adults living in the community.
This cross-sectional study analyzed the pre-existing data from the Korean Frailty and Aging Cohort Study. A total of 435 older people (aged 70–84 years) were divided into the following groups according to their Limb Asymmetry Index (LAsI): low, intermediate, and high asymmetric groups. LAsI is calculated using lower extremity lean mass, and comparisons between groups were conducted. The participants were also further divided into better and worse mobility groups based on their physical performance test results (Timed Up and Go and Short Physical Performance Battery), and comparisons between groups were conducted. Comparisons between fallers and non-fallers were also conducted. In addition, this study investigated the factors that had a significant effect on gait speed and fall experience within the past year among older adults living in the community.
The LAsI was significantly associated with gait speed in older adults living in the community. Older adults in the highest tertile of the LAsI had a slower gait speed than those in the lowest tertile of the LAsI. However, no significant difference was observed in the LAsI between the better mobility group and worse mobility group. Moreover, the LAsI was not a significant predictor of falls.
Asymmetry in lower extremity lean mass was significantly associated with gait speed in older adults living in the community.
Keywords: asymmetry, functional mobility, lower extremity lean mass, older adults
1. Introduction
Aging is usually accompanied by loss of muscle mass, which starts after the fourth decade of life.[1] Loss of muscle mass in older people leads to a decrease in muscle strength and power.[2] Reduction in muscle function, which results in decreased mobility, is an important issue in older people.[3,4] The decline in mobility is significantly correlated with falls.[5] In particular, poor lower extremity function is the primary risk factor for falls among older adults living in the community.[6]
To date, several studies have already reported on the asymmetry in the muscle strength of older adults living in the community.[7–10] Mark et al demonstrated that both older fallers (aged 76.4 ± 0.8 years) and older non-fallers (aged 75.9 ± 0.6 years) had greater asymmetry in leg power than the younger groups (aged 29.3 ± 0.6 years).[7] Furthermore, a previous study reported that asymmetry in lower extremity strength led to a disruption in balance in older people aged 65 to 80 years.[8] Portegijs et al demonstrated that lower limb strength asymmetry in older people aged 63 to 75 years is significantly associated with lower walking velocity and poorer standing balance.[9] Another study involving elderly people reported that the fallers demonstrated a significantly greater asymmetry in lower limb power than the non-fallers.[10]
However, to the authors’ knowledge, no previous studies have investigated the asymmetry in lower extremity muscle mass in older adults living in the community. Although some studies showed that leg lean mass is associated with functional impairment, these studies only focused on assessing the total leg lean mass.[11,12] Just as there is asymmetry in leg strength, regardless of disease, asymmetry also exists in the muscle mass of the legs. Victor et al reported that the calf circumference of the dominant leg was significantly larger than that of the non-dominant leg in adults with a mean age of 53.6 years.[13]
Hence, the present study aimed to assess the asymmetry in muscle mass, specifically lean mass. Lean mass was measured using dual-energy X-ray absorptiometry (DEXA; Hologic Inc., Waltham, MA). DEXA is a reliable method for estimating muscle mass.[14] Currently, lean mass measurement has been widely used in studies on frailty and sarcopenia.[15]
The present study hypothesized that older people with greater lower extremity lean mass asymmetry had poorer mobility than those with lesser asymmetry. This study aimed to assess the association between asymmetry in lower extremity lean mass and decreased mobility in older adults living in the community.
2. Methods
2.1. Participants
This cross-sectional study utilized a pre-existing database from the Korean Frailty and Aging Cohort Study (KFACS). The KFACS was initiated in 2016 to assess the risk factors of frailty in older adults living in the community.[16,17] This cohort study is a multi-center longitudinal study, and the baseline survey was conducted in 2016 to 2017. In the first year, 1559 older people aged 70 to 84 years, stratified by age and sex, were recruited from 10 hospitals nationwide across urban and rural regions. In-person interviews and health examinations were conducted to collect data on health status (comorbidity), cognitive function (using the Korean version of Mini-Mental Status Examination (MMSE-K)), and anthropometric measurements (height, body weight, body mass index (BMI), lean mass by DEXA, etc.). Of the 1559 participants, 580 underwent lean mass measurements by DEXA (Hologic Inc., Waltham, MA).
Participants who had a disease (stroke and hemiplegia) that obviously caused asymmetry in the leg muscle mass, with difficulty following directions because of cognitive decline (MMSE-K score ≤23), and with difficulty conducting physical performance tests because of a clinical condition (malignancy) were excluded. Some of the participants who were excluded from the study met more than two of the exclusion criteria.
Finally, 435 older adults (206 men and 229 women, aged 70–84 years) were included in the analysis (Fig. 1). All participants conducted physical performance tests (Timed Up and Go (TUG), Short Physical Performance Battery (SPPB)) and answered the SARC-F questionnaire. This study was approved by the appropriate Institutional Review Board of Kyung Hee University Hospital (no. KHUHMDIRB 2015-12-103).
Figure 1.
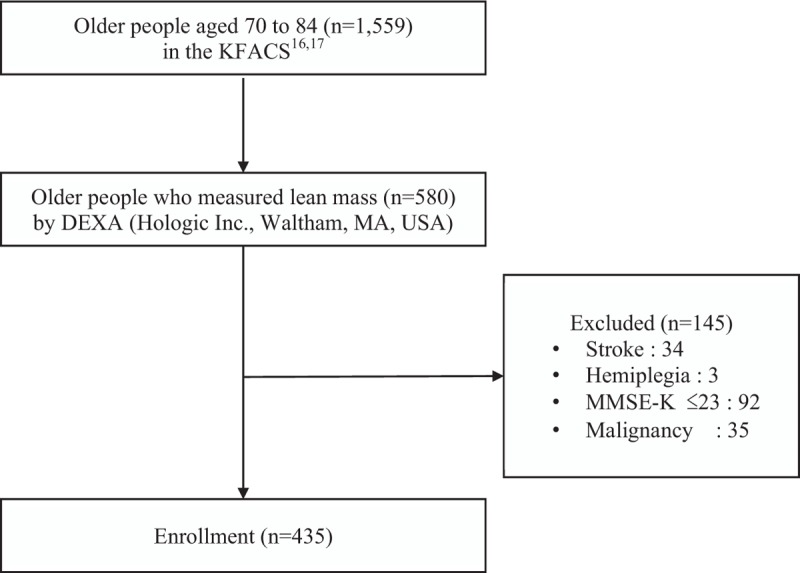
Flowchart of the process of participant selection. DEXA = dual-energy X-ray absorptiometry, KFACS = Korean Frailty and Aging Cohort Study, MMSE-K = Korean – Mini Mental State Examination.
2.2. Lean mass and limb asymmetry index
Lower extremity lean mass was measured using DEXA (Hologic Inc., Waltham, MA). The lower extremity region included the entire lower extremities below the pelvis. Three parameters were obtained using lower extremity lean mass. First, the difference in lean mass of each leg was obtained by subtracting the light leg lean mass from the heavy leg lean mass. Second, the lean mass of both legs was calculated by adding the light and heavy leg lean masses. Third, the Limb Asymmetry Index (LAsI) was established as an index of asymmetry and calculated using the following equation[18]:
 |
In this study, LAsIs were listed in ascending order and then divided into three groups so that the number of participants in each group was the same. Each group comprised 165 older participants: “low asymmetric” group, “intermediate asymmetric” group, and “high asymmetric” group.
2.3. BMI
The World Health Organization (WHO) provided BMI standards to classify overweight and obesity in adults.[19] The BMI cut-offs for adult Asians as recommended by the WHO were as follows[20]: underweight, BMI <18.5 kg/m2; normal weight, BMI = 18.5–22.9 kg/m2; pre-obesity, BMI = 23–24.9 kg/m2; and obesity, BMI ≥ 25.0 kg/m2. BMI was calculated as weight in kilograms divided by height in meters squared. Anthropometric variables were assessed using the same protocols while the participants were wearing light clothes and stood barefoot.
2.4. Physical performance tests
2.4.1. TUG test
The TUG test is a simple tool used to assess functional mobility in older people. The participants were asked to sit on a chair (seat height: 46 cm), stand up, walk to a line on the floor 3 meters away, then return, and sit back on the chair. The participant can use a cane or a walker if necessary. The examiner measured the time it took the participant to perform the test.[21] A lesser time taken to perform the test indicated better functional mobility. A cut-off value of ≥10 seconds was used to identify older people living in the community at an increased risk of falls.[22]
2.4.2. SPPB and gait speed
The SPPB is a widely used tool to assess functional mobility including standing balance, gait speed, and sit-to-stand performance. The SPPB consists of 3 components: a stand test that assesses whether an older individual can stand for >10 seconds in side-by-side posture, semi-tandem posture, and tandem posture, respectively; a gait speed test that measures the time it takes for an older individual to walk 4 meters; and a chair stand test that measures the time it takes for an older individual to sit on a chair and get up 5 times.[23] The score of each test ranges from 0 to 4, and the total score ranges from 0 to 12. A higher score indicated better functional mobility.[24,25] A cut-off value of ≤10 points indicates that older people living in the community are at a high risk of functional mobility limitations.[26]
Additionally, the gait speed of participants was assessed on the basis of the results of their gait speed test. Gait speed was calculated by dividing 4 meters by the time taken to perform the gait speed test.
2.5. Fall experience
This study used “falls” data from the SARC-F questionnaire to assess the correlation between asymmetry in lower extremity lean mass and experience of falls in the past year.
SARC-F is a simple tool used for diagnosing sarcopenia.[27] The questionnaire includes 5 items: strength, assistance walking, rising from a chair, climbing stairs, and falls.
-
(1)
Strength was assessed by asking the following question: How difficult is it for you to lift or carry 4.5 kg?
-
(2)
Assistance walking: How difficult is it for you to walk across a room?
-
(3)
Rising from a chair: How difficult is it for you to rise from a chair (wheelchair) and get onto the bed?
-
(4)
Climbing stairs: How difficult is it for you to climb a flight of 10 stairs without a break? Each item was scored as follows: 0 = no difficulty, 1 = some difficulty, and 2 = a lot of difficulty or unable to do the tasks.
-
(5)
Falls: How many times did you fall during the past year? This item was scored as follows: 0 = no, 1 = 1–3 times, and 2 = 4 or more times.
The total score was obtained by adding the scores of each item. The participant with a total score of ≥4 points was diagnosed with sarcopenia.[27] The Korean version of SARC-F was validated.[28] The SARC-F questionnaire was administered via an in-person interview.
2.6. MMSE-K
The MMSE is a simple tool used for assessing cognitive function.[29,30] The MMSE-K is the Korean version of the MMSE. The MMSE-K includes the following items: orientation (10 points), verbal memory (6 points), concentration and calculation (5 points), language (3 points), praxis (3 points), judgement (2 points), and visuospatial construction (1 points).[31] The MMSE-K was standardized and validated in the Korean older people.[32,33] Scores range from 0 to 30 points, and higher scores indicate better cognitive function. The cut-off score of ≤23 points indicates dementia.[32]
2.7. Statistical analysis
Data were analyzed using the Statistical Package for the Social Sciences (SPSS) version 18.0 for Windows (SPSS Inc., Chicago, IL). The Kolmogorov-Smirnov test was performed to check the normal distribution of variables. Both BMI and gait speed were normally distributed, but other variables including the LAsI, scores of SPPB, and the time spent performing the TUG were not normally distributed. After log transformation, almost all variables except the lean mass of both legs remained non-normative.
Comparisons among the three groups (low asymmetric group, intermediate asymmetric group, and high asymmetric group) were conducted using one-way analysis of variance (ANOVA) for parametric values and Kruskal-Wallis test for non-parametric values. This study used Tukey's test for post-hoc analysis after ANOVA. Pearson's chi-square test was used to assess sex distribution among groups.
After the participants were divided into 2 groups (better mobility group and worse mobility group) based on physical performance tests, comparisons between the 2 groups were conducted using the independent t test for parametric values and the Mann–Whitney U test for non-parametric values. Pearson chi-square test was used to assess the sex distribution among groups. Comparisons between fallers and non-fallers were also conducted using same statistical methods as above.
Multiple linear regression analysis was conducted to assess the relationship between gait speed and variables. A stepwise binary logistic regression analysis was used to assess which variables were associated with fall experience. The Hosmer–Lemeshow test was conducted to check the goodness of fit for logistic regression models and showed that the model was a good fit. Results with P values <.05 were considered significant.
3. Results
3.1. Comparison of functional mobility among low asymmetric, intermediate asymmetric, and high asymmetric group
Descriptive statistics are shown in Table 1. This study included 435 older people (aged (mean ± SD) 75.84 ± 3.96 years). Each group comprised 165 participants. The Pearson chi-square test showed no significant difference in sex distribution among the three groups (P = .22).
Table 1.
Comparisons of descriptive statistics among the 3 groups.
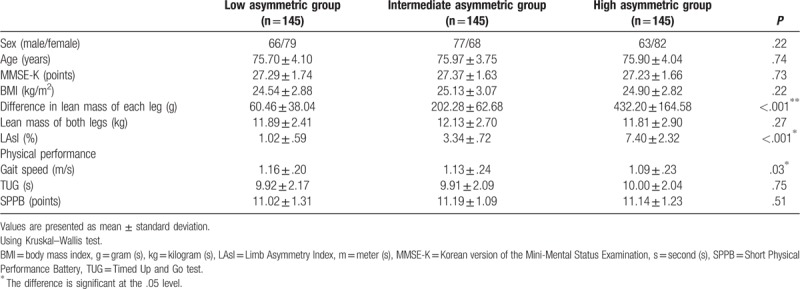
A significant difference was observed in the gait speed among the three groups (P = .03). On post-hoc analysis using Tukey test, the gait speed of the high asymmetric group (1.09 ± .23 m/s) was significantly slower than that of the low asymmetric group (1.16 ± .20 m/s) (P = .03). There was no significant difference in the gait speed between the low and intermediate asymmetric groups. There was also no significant difference in the gait speed between the intermediate and high asymmetric groups. Results of TUG and SPPB were not significantly different among the 3 groups.
3.2. Comparison of descriptive statistics between the better mobility group and worse mobility group
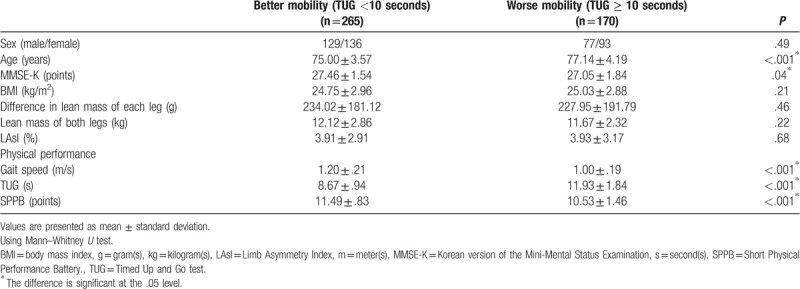
First, on the basis of the cut-off value of 10 seconds in TUG, the better mobility group (TUG <10 seconds) included 265 older people, and the worse mobility group (TUG ≥10 seconds) included 170 older people (Table 2). MMSE-K, gait speed, and SPPB were significantly higher in the better mobility group than in the worse mobility group (P = .04, P < .001, and P < .001, respectively). Age and TUG were significantly lower in the better mobility group than in the worse mobility group (P < .001 and P < .001, respectively). There was no significant difference in BMI, difference in lean mass of each leg, lean mass of both legs, and LAsI between the two groups. In Pearson chi-square test, no significant difference was found between the two groups (P = .49) in terms of sex distribution.
Table 2.
Comparisons between the better mobility group (TUG <10 seconds) and worse mobility group (TUG ≥ 10 seconds).
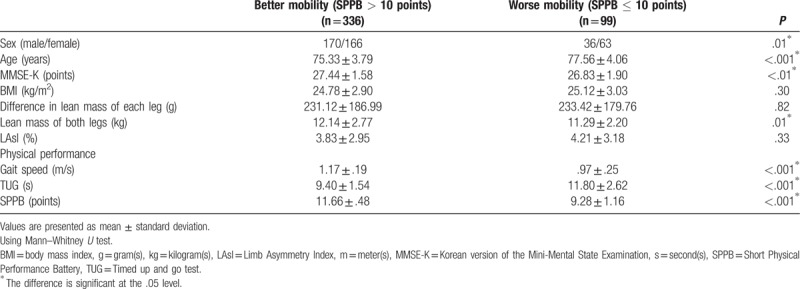
Second, on the basis of a cut-off value of 10 points in SPPB, the better mobility group (SPPB score >10) included 336 older people and the worse mobility group (SPPB score ≤10) included 99 older people (Table 3). MMSE-K, lean mass of both legs, gait speed, and SPPB were significantly higher in the better mobility group than in the worse mobility group (P < .01, P = .01, P < .001, and P < .001, respectively). Age and TUG were significantly lower in better mobility group compared to worse mobility group (P < .001 and P < .001, respectively). There was no significant difference in BMI, difference in lean mass of each leg, and LAsI between the 2 groups. In Pearson chi-square test, a significant difference was observed in sex distribution between the 2 groups (P = .01). The better mobility group was 1.79 times more likely to have male participants than the worse mobility group (odds ratio (OR) = 1.79, 95% confidence interval (CI) = 1.12–2.84).
Table 3.
Comparisons between the better mobility group (SPPB > 10 points) and worse mobility group (SPPB ≤ 10 points).
3.3. Factors associated with gait speed
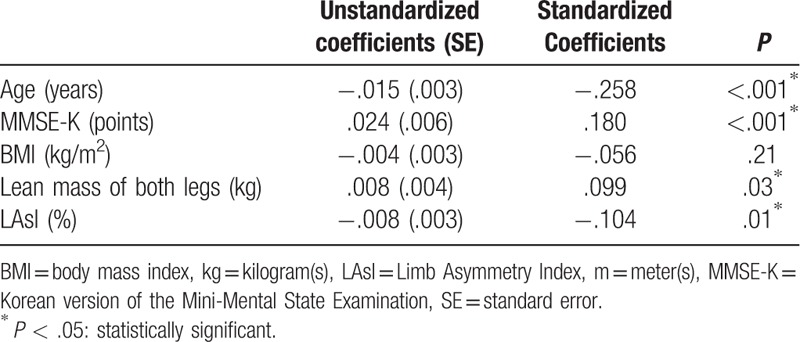
Table 4 summarizes the results of the multiple linear regression analysis to assess the factors affecting gait speed. Gait speed had a significant correlation with age, MMSE-K, lean mass of both legs, and LAsI. Gait speed had a negative correlation with age (coefficient: −.015, P < .001) and LAsI (coefficient: −.008, P = .01) but had a positive correlation with MMSE-K (coefficient: .024, P < .001) and the lean mass of both legs (coefficient: .008, P = .03). This regression model showed a 14% variation in gait speed. There was no multicollinearity between variables.
Table 4.
A multiple linear regression analysis in the gait speed.
3.4. Factors associated with fall experience in the past year
Table 5 summarizes the descriptive statistics of fallers and non-fallers. Of the total participants, 73 older people answered that they experienced falls within 1 year. The faller group had higher TUG scores than the non-faller group (P = .04). Gait speed was significantly lower in the faller group than in the non-faller group (P = .03).
Table 5.
Comparisons between fallers and non-fallers.
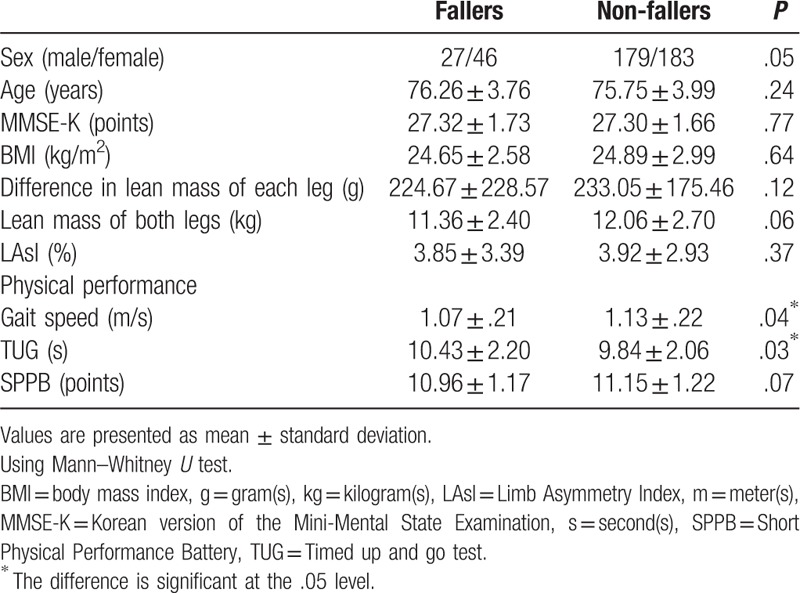
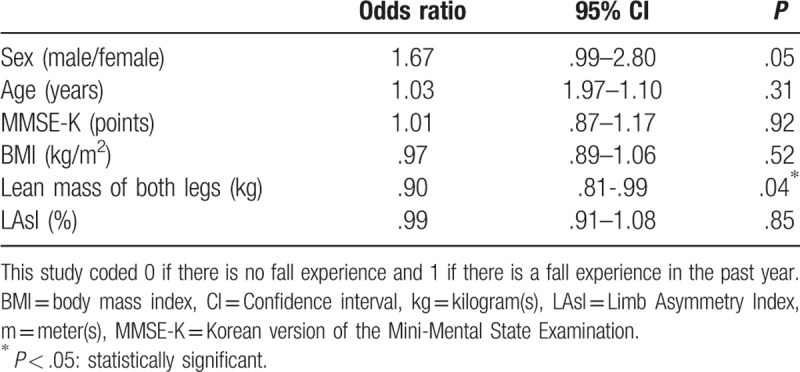
Table 6 summarizes the results of the stepwise binary logistic regression analysis to identify the factors affecting fall experience in the past year. The lean mass of both legs was only significantly correlated with fall experience and was found to be a negative predictor of fall experience (OR = .90, 95% CI = .81–.99, P = .04). The LAsI was not significantly associated with fall episodes (OR = .99, 95% CI = .91–1.08, P = .85).
Table 6.
A binary logistic regression analysis in fall experience in the past year.
4. Discussion
To the authors’ knowledge, this is the first large-scale study to assess the association between asymmetry in lower extremity lean mass and functional mobility in older adults living in the community. In this study, asymmetry in lower extremity lean mass showed a significant relationship with gait speed in older adults living in the community. The participants in the high asymmetric group walked significantly slower than those in the low asymmetric group (P = .03). The multiple linear regression analysis also showed that gait speed decreases as LAsI increases (coefficient: −.008, P = .01). Meanwhile, LAsI was not significantly different between the better mobility group and worse mobility group regardless of the type of physical performance tests. In addition, LAsI had no significant relationship with falls. In summary, LAsI was not associated with fall and functional mobility except gait speed.
On the contrary, the asymmetry in leg strength has been reported to show a significant correlation with physical performance and fall episodes in older adults living in the community.[9,10] Based on these findings, muscle mass itself does not seem to represent muscle strength. Of course, changes in muscle mass primarily affect muscle strength, but other factors such as a muscle composition, neuromuscular control, and joint coordination can act as covariates.[34] According to a previous study evaluating the relationship between muscle mass and muscle strength, asymmetry in the lower extremity lean mass was only partially responsible for asymmetry in force and power, but a large percentage remained unexplained.[18] They demonstrated that asymmetry in thigh and shank lean mass only accounted for 20% of the variations in force asymmetry. In addition, lean mass is directly associated with joint torque[35] and lower levels of legs lean mass are related with greater laxity in the rotational and frontal planes at the knee.[36] Hence, further studies, including other covariates, are needed to assess the relationship between muscle mass and functional mobility.
After dividing the participants into two groups (better and worse mobility group), age showed a significant difference between the 2 groups regardless of type of tests (TUG and SPPB) (P < .001 by TUG, P < .001 by SPPB). These results were consistent with those of previous studies.[37,38] MMSE-K score was also significantly different between the better mobility group and worse mobility group regardless of type of tests (P = .04 by TUG, P < .01 by SPPB). This study excluded older people with MMSE-K ≤23 points, that is, people who were classified as having cognitive dysfunction, because of the possibility that this patient group could not perform the instructions properly. Nevertheless, it seemed that cognitive function still affected physical performance, which was assessed using TUG and SPPB.
In this study, the lean mass of both legs was significantly different between the better and worse group divided by SPPB (P = .01), but the lean mass of both legs was not significantly different the 2 groups divided by TUG (P = .22). This study found that the better mobility group was 1.79 times more likely to be have male participants than the worse mobility group when divided by SPPB. This difference in gender distribution may have resulted in a significant difference in the lean mass of both legs between the better and worse mobility group by SPPB.
The data on the relationship between the both legs muscle mass and physical performance is limited, and previous researchers were unable to confirm if these 2 variables have a significant relationship.[11,39] A previous study including 753 individuals aged 72 to 95 years demonstrated that the total leg muscle mass was not associated with disability as assessed by a questionnaire,[39] whereas another study including mobility-limited older people (SPPB score ≤9 points) reported that total lower extremity muscle mass was a strong predictor of the level of functional impairment.[11] Hence, further studies with consistent inclusion criteria, using a specific performance test, and using a constant cut-off value are needed.
Meanwhile, the lean mass of both legs appeared to be the only significant predictor of falls (P = .04). As the lean mass of both legs increases, the prevalence of falls decreases (OR = .90, 95% CI = .81–.99). To the best of the authors’ knowledge, no previous study has investigated the relationship between muscle mass of both legs and fall episodes. However, one study demonstrated a significant relationship between falls and the sum of lean mass in both arms and legs.[40] Among 796 men aged 50 to 85 years, those in the highest tertile of relative appendicular muscle mass were less likely to report a fall in the past year (OR = 0.66, 95% CI = 0.44–0.99). The present study showed that falls had a significant relationship with the lean mass of both legs.
In this study, BMI was not significant in any analysis. Previous studies showed that obesity has a significant association with functional mobility and falls in older people.[41,42] Kim et al reported that compared with the healthy group (18.5 ≤ BMI < 23), the obesity BMI group (BMI ≥ 25) showed a significant association with falls in the older people (OR = 1.06, 95% CI = 1.02–1.10).[41] Cecilie demonstrated that the obese group reported a higher prevalence of falls (27% vs 15%) and ambulatory stumbling (32% vs 14%) than the normal weight group.[42] However, other previous studies reported inconsistent findings. One study found that obesity did not increase the overall fall risk in 86 women aged 55 years and older.[43] Another study reported that BMI was significantly associated with mobility, as assessed by TUG, but was not associated with standing balance and fall history in 120 older adults (mean age = 77.6 years).[44] The authors stated that it is plausible that changes in body fat distribution are related more to postural instability than to BMI alone. In the present study, as BMI increased, gait speed tended to decrease, while falling experience tended to decrease, although the results were not statistically significant. Further studies must perform more-detailed analyses, including fat distribution.
The limitations of this study were as follows: First, this study used data obtained from voluntary participants of the KFACS; hence, there might be voluntary bias, including the older individuals who have a relatively good mobility. Second, this study may not have completely excluded comorbidities that could affect lean mass and/or functional mobility. This study excluded comorbidities that seemed to have an obvious effect, such as stroke and hemiplegia. However, various diseases, including cardiovascular diseases, respiratory diseases, and osteoarthritis, whose influence seemed ambiguous were not excluded. In particular, osteoarthritis of the knee was reported to be associated with decreased muscle mass in 4246 adults aged 50 years and over.[45] However, survey data were limited. Data on whether older people had arthritis or not were the only information available. There was no information on which joints had osteoarthritis and how severe it was. Third, data on lower extremity strength were not obtained in KFACS. If data on strength were obtained, it would have been possible to study the relationship between mass and strength of the lower extremity. It could have analyzed the relationship between the asymmetry in lower extremity strength and physical performance, including falls, and compared it with the results of muscle mass asymmetry.
Asymmetry in lower extremity lean mass showed a significant relationship with gait speed in older adults living in the community. However, it was difficult to determine whether asymmetry was significantly related to clinical problems such as fall experience. Future studies of the risk factors for falls and worse mobility in older adults living in the community must include muscle composition, joint coordination, osteoarthritis, muscle strength, and muscle mass.
Author contributions
Conceptualization: Eun Jeong Lee, Jinmann Chon.
Data curation: Chang Won Won.
Formal analysis: Jinmann Chon.
Funding acquisition: Seung Ah Lee, Chang Won Won.
Investigation: Eun Jeong Lee.
Methodology: Eun Jeong Lee, Yunsoo Soh, Jinmann Chon.
Project administration: Chang Won Won.
Resources: Yunsoo Soh, Yong Kim.
Software: Eun Jeong Lee, Yunsoo Soh, Yong Kim.
Supervision: Jinmann Chon.
Validation: Seung Ah Lee, Chang Won Won, Jinmann Chon.
Visualization: Yunsoo Soh, Yong Kim.
Writing – original draft: Eun Jeong Lee.
Writing – review & editing: Seung Ah Lee, Yunsoo Soh, Yong Kim, Jinmann Chon.
Eun Jeong Lee orcid: 0000-0002-0451-6026.
Footnotes
Abbreviations: ANOVA = analysis of variance, BMI = body mass index, CI = confidence interval, DEXA = dual-energy X-ray absorptiometry, KFACS = Korean Frailty and Aging Cohort Study, LAsI = Limb Asymmetry Index, MMSE-K = Mini-Mental Status Examination, OR = odds ratio, SPPB = Short Physical Performance Battery, TUG = Timed Up and Go, WHO = World Health Organization.
How to cite this article: Lee EJ, Lee SA, Soh Y, Kim Y, Won CW, Chon J. Association between asymmetry in lower extremity lean mass and functional mobility in older adults living in the community. Medicine. 2019;98:45(e17882).
This research was supported by a grant from the Korea Health Technology R&D Project through the Korean Health Industry Development Institute, funded by the Ministry of Health and Welfare, Republic of Korea (grant number: HI15C3153).
The authors report no conflicts of interest.
References
- [1].Kyle U, Genton L, Hans D, et al. Age-related differences in fat-free mass, skeletal muscle, body cell mass and fat mass between 18 and 94 years. Eur J Clin Nutr 2001;55:663–72. [DOI] [PubMed] [Google Scholar]
- [2].Goodpaster BH, Park SW, Harris TB, et al. The loss of skeletal muscle strength, mass, and quality in older adults: the health, aging and body composition study. J Gerontol A Biol Sci Med Sci 2006;61:1059–64. [DOI] [PubMed] [Google Scholar]
- [3].Schaap LA, Koster A, Visser M. Adiposity, muscle mass, and muscle strength in relation to functional decline in older persons. Epidemiol Rev 2012;35:51–65. [DOI] [PubMed] [Google Scholar]
- [4].Visser M, Goodpaster BH, Kritchevsky SB, et al. Muscle mass, muscle strength, and muscle fat infiltration as predictors of incident mobility limitations in well-functioning older persons. J Gerontol A Biol Sci Med Sci 2005;60:324–33. [DOI] [PubMed] [Google Scholar]
- [5].Rubenstein LZ. Falls in older people: epidemiology, risk factors and strategies for prevention. Age Ageing 2006;35:ii37–41. [DOI] [PubMed] [Google Scholar]
- [6].Morita M, Takamura N, Kusano Y, et al. Relationship between falls and physical performance measures among community-dwelling elderly women in Japan. Aging Clin Exp Res 2005;17:211–6. [DOI] [PubMed] [Google Scholar]
- [7].Perry MC, Carville SF, Smith ICH, et al. Strength, power output and symmetry of leg muscles: effect of age and history of falling. Eur J Appl Physiol 2007;100:553–61. [DOI] [PubMed] [Google Scholar]
- [8].LaRoche DP, Cook SB, Mackala K. Strength asymmetry increases gait asymmetry and variability in older women. Med Sci Sports Exerc 2012;44:2172–81. [DOI] [PMC free article] [PubMed] [Google Scholar]
- [9].Portegijs E, Sipilä S, Alen M, et al. Leg extension power asymmetry and mobility limitation in healthy older women. Arch Phys Med Rehabil 2005;86:1838–42. [DOI] [PubMed] [Google Scholar]
- [10].Skelton DA, Kennedy J, Rutherford OM. Explosive power and asymmetry in leg muscle function in frequent fallers and non-fallers aged over 65. Age Ageing 2002;31:119–25. [DOI] [PubMed] [Google Scholar]
- [11].Reid KF, Naumova EN, Carabello RJ, et al. Lower extremity muscle mass predicts functional performance in mobility-limited elders. J Nutr Health Aging 2008;12:493–8. [DOI] [PMC free article] [PubMed] [Google Scholar]
- [12].Stoever K, Heber A, Eichberg S, et al. Sarcopenia and predictors of skeletal muscle mass in elderly men with and without obesity. Gerontol Geriatr Med 2017;3: 2333721417713637. [DOI] [PMC free article] [PubMed] [Google Scholar]
- [13].Valderrabano V, Nigg BM, Hintermann B, et al. Muscular lower leg asymmetry in middle-aged people. Foot Ankle Int 2007;28:242–9. [DOI] [PubMed] [Google Scholar]
- [14].Kim J, Wang Z, Heymsfield SB, et al. Total-body skeletal muscle mass: estimation by a new dual-energy X-ray absorptiometry method. Am J Clin Nutr 2002;76:378–83. [DOI] [PubMed] [Google Scholar]
- [15].Spira D, Buchmann N, Nikolov J, et al. Association of low lean mass with frailty and physical performance: a comparison between two operational definitions of sarcopenia—data from the Berlin Aging Study II (BASE-II). J Gerontol A Biol Sci Med Sci 2015;70:779–84. [DOI] [PubMed] [Google Scholar]
- [16].Won CW, Lee Y, Choi J, et al. Starting construction of frailty cohort for elderly and intervention study. Ann Geriatr Med Res 2016;20:114–7. [Google Scholar]
- [17].Kim S, Kim M, Lee Y, et al. Calf circumference as a simple screening marker for diagnosing sarcopenia in older Korean adults: the Korean Frailty and Aging Cohort Study (KFACS). J Korean Med Sci 2018;33:e151. [DOI] [PMC free article] [PubMed] [Google Scholar]
- [18].Bell DR, Sanfilippo JL, Binkley N, et al. Lean mass asymmetry influences force and power asymmetry during jumping in collegiate athletes. J Strength Cond Res 2014;28:884–91. [DOI] [PMC free article] [PubMed] [Google Scholar]
- [19].World Health Organization. Obesity: preventing and managing the global epidemic. Report of a WHO consultation. World Health Organ Tech Rep Ser 2000;894:1–253. [PubMed] [Google Scholar]
- [20].Who Expert Consultation. Appropriate body-mass index for Asian populations and its implications for policy and intervention strategies. Lancet 2004;363:157–63. [DOI] [PubMed] [Google Scholar]
- [21].Podsiadlo D, Richardson S. The timed “Up & Go”: a test of basic functional mobility for frail elderly persons. J Am Geriatr Soc 1991;39:142–8. [DOI] [PubMed] [Google Scholar]
- [22].Rose DJ, Jones CJ, Lucchese N. Predicting the probability of falls in community-residing older adults using the 8-foot up-and-go: a new measure of functional mobility. J Aging Phys Act 2002;10:466–75. [Google Scholar]
- [23].Guralnik JM, Simonsick EM, Ferrucci L, et al. A short physical performance battery assessing lower extremity function: association with self-reported disability and prediction of mortality and nursing home admission. J Gerontol 1994;49:M85–94. [DOI] [PubMed] [Google Scholar]
- [24].van den Berg M, Sherrington C, Killington M, et al. Video and computer-based interactive exercises are safe and improve task-specific balance in geriatric and neurological rehabilitation: a randomised trial. J Physiother 2016;62:20–8. [DOI] [PubMed] [Google Scholar]
- [25].Riskowski J, Hagedorn T, Dufour A, et al. Functional foot symmetry and its relation to lower extremity physical performance in older adults: the Framingham Foot Study. J Biomech 2012;45:1796–802. [DOI] [PMC free article] [PubMed] [Google Scholar]
- [26].Vasunilashorn S, Coppin AK, Patel KV, et al. Use of the short physical performance battery score to predict loss of ability to walk 400 meters: analysis from the InCHIANTI study. J Gerontol A Biol Sci Med Sci 2009;64:223–9. [DOI] [PMC free article] [PubMed] [Google Scholar]
- [27].Malmstrom TK, Miller DK, Simonsick EM, et al. SARC-F: a symptom score to predict persons with sarcopenia at risk for poor functional outcomes. J Cachexia Sarcopenia Muscle 2016;7:28–36. [DOI] [PMC free article] [PubMed] [Google Scholar]
- [28].Kim S, Kim M, Won CW. Validation of the Korean version of the SARC-F questionnaire to assess sarcopenia: Korean frailty and aging cohort study. J Am Med Dir Assoc 2018;19:40–5. e1. [DOI] [PubMed] [Google Scholar]
- [29].Folstein MF, Folstein SE, McHugh PR. “Mini-mental state”: a practical method for grading the cognitive state of patients for the clinician. J Psychiatr Res 1975;12:189–98. [DOI] [PubMed] [Google Scholar]
- [30].Tombaugh TN, McIntyre NJ. The mini-mental state examination: a comprehensive review. J Am Geriatr Soc 1992;40:922–35. [DOI] [PubMed] [Google Scholar]
- [31].Park JH, Kwon YC. Modification of the mini-mental state examination for use in the elderly in a non-western society. Part 1. Development of Korean version of mini-mental state examination. Int J Geriatr Psychiatry 1990;5:381–7. [Google Scholar]
- [32].Park JH, Park YN, Ko HJ. Modification of the mini-mental state examination for use with the elderly in a non-western society. Part II: cutoff points and their diagnostic validities. Int J Geriatr Psychiatry 1991;6:875–82. [Google Scholar]
- [33].Lee DY, Lee KU, Lee JH, et al. A normative study of the mini-mental state examination in the Korean elderly. J Korean Neuropsychiatr Assoc 2002;41:508–25. [Google Scholar]
- [34].Tieland M, Trouwborst I, Clark BC. Skeletal muscle performance and ageing. J Cachexia Sarcopenia Muscle 2018;9:3–19. [DOI] [PMC free article] [PubMed] [Google Scholar]
- [35].Fukunaga T, Miyatani M, Tachi M, et al. Muscle volume is a major determinant of joint torque in humans. Acta Physiol Scand 2001;172:249–55. [DOI] [PubMed] [Google Scholar]
- [36].Shultz SJ, Pye ML, Montgomery MM, et al. Associations between lower extremity muscle mass and multiplanar knee laxity and stiffness: a potential explanation for sex differences in frontal and transverse plane knee laxity. Am J Sports Med 2012;40:2836–44. [DOI] [PubMed] [Google Scholar]
- [37].Nakano MM, Otonari TS, Takara KS, et al. Physical performance, balance, mobility, and muscle strength decline at different rates in elderly people. J Phys Ther Sci 2014;26:583–6. [DOI] [PMC free article] [PubMed] [Google Scholar]
- [38].Wiacek M, Zubrzycki IZ. The age-dependent divergence of strength and coordinating parameters among men and women: the cross-sectional studies. Arch Gerontol Geriatr 2010;51:e75–8. [DOI] [PubMed] [Google Scholar]
- [39].Visser M, Harris T, Langlois J, et al. Body fat and skeletal muscle mass in relation to physical disability in very old men and women of the Framingham Heart Study. J Gerontol A Biol Sci Med Sci 1998;53:M214–21. [DOI] [PubMed] [Google Scholar]
- [40].Szulc P, Beck TJ, Marchand F, et al. Low skeletal muscle mass is associated with poor structural parameters of bone and impaired balance in elderly men–the MINOS study. J Bone Miner Res 2005;20:721–9. [DOI] [PubMed] [Google Scholar]
- [41].Kim SY, Kim MS, Sim S, et al. Association between obesity and falls among Korean adults: a population-based cross-sectional study. Medicine (Baltimore) 2016;95:e3130. [DOI] [PMC free article] [PubMed] [Google Scholar]
- [42].Fjeldstad C, Fjeldstad AS, Acree LS, et al. The influence of obesity on falls and quality of life. Dyn Med 2008;7:4. [DOI] [PMC free article] [PubMed] [Google Scholar]
- [43].Rosenblatt NJ, Grabiner MD. Relationship between obesity and falls by middle-aged and older women. Arch Phys Med Rehabil 2012;93:718–22. [DOI] [PubMed] [Google Scholar]
- [44].Hergenroeder AL, Wert DM, Hile ES, et al. Association of body mass index with self-report and performance-based measures of balance and mobility. Phys Ther 2011;91:1223–34. [DOI] [PMC free article] [PubMed] [Google Scholar]
- [45].Suh D, Han K, Hong J, et al. Body composition is more closely related to the development of knee osteoarthritis in women than men: a cross-sectional study using the Fifth Korea National Health and Nutrition Examination Survey (KNHANES V-1, 2). Osteoarthritis Cartilage 2016;24:605–11. [DOI] [PubMed] [Google Scholar]


