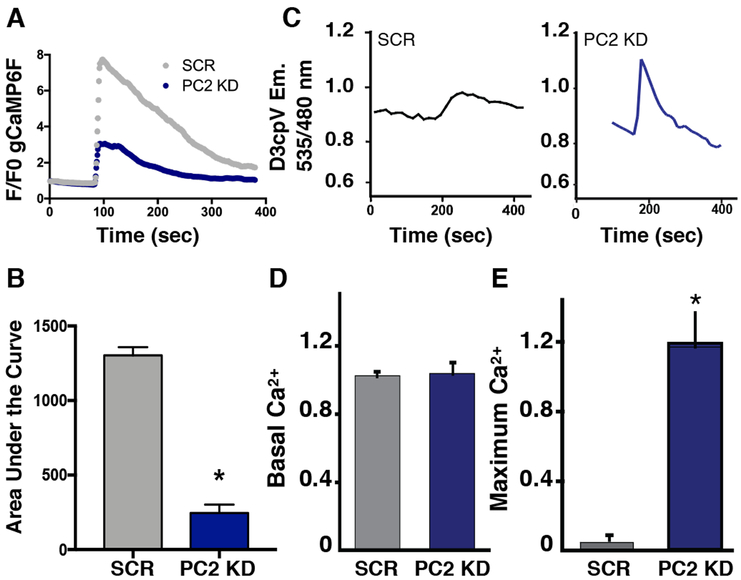
Figure 1: PC2 knockdown results in decreased cytoplasmic but increased mitochondrial Ca2+ signals.
A). Measurements of the cytoplasmic Ca2+ signal in response to 5 μM ATP (measured using GCaMP6F) in PC2 KD cells compared to SCR cells. B). Quantification of area under the curve of the GCaMP6F cytoplasmic Ca2+ amplitude. p < 0.0001 determined by Unpaired t test. n = 30-94 cells from at least 3 independent experiments. C). Example traces depicting mitochondrial Ca2+ measurements using the FRET sensor 4mitD3cpV in SCR cells (left) and PC2 KD cells (right) in response to 5 μM ATP. D). Averaged data of the baseline mitochondrial Ca2+ levels measured with 4mitD3cpV. Data determined not significant by Unpaired t test. E). Averaged mitochondrial maximum Ca2+ response after 5 μM ATP stimulus measured with 4mitD3cpV. p < 0.05 determined by Unpaired t test. SCR: n=3 individual experiments with 12 cells per experiment; PC2 KD: n=6 individual experiments with 27 cells per experiment.

