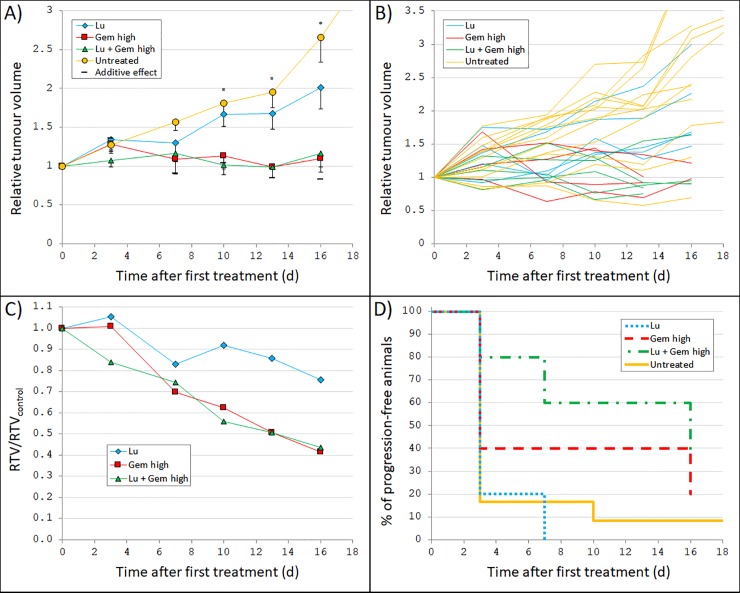
Fig 1. Tumour growth after 177Lu-octreotate and/or gemcitabine treatment.
GOT2-carrying nude mice were treated with 10 MBq 177Lu-octreotate (Lu) and/or 125 mg/kg (initially, but lowered to 60 mg/kg) gemcitabine twice weekly (Gem high). The 177Lu activity and amount of gemcitabine were chosen to give low to moderate effect as single treatment to enable detection of any additive or synergistic effects. (A) Mean relative tumour volume (RTV) vs. time after first treatment. In addition to the measured values for each group, also the calculated relative tumour volume given a predicted additive response (Eq (2)) is shown. Error bars show SEM. A star indicate that the ANOVA analyses (performed at day 3–16) resulted in a statistically significant difference between the group means. (B) RTV vs. time after first treatment for each individual mouse. (C) Mean RTV for each treatment group divided by mean RTV for the untreated control group (RTV/RTVcontrol) vs. time after first treatment. (D) Percentage of animals in each group without tumour progression vs. time after first treatment. Not all animals reached tumour progression before the end of follow-up, and therefore, some lines end at values higher than 0%. The line for the untreated control animals continues past 16 days because the follow-up time was longer for these animals. Note differences in scale of the x-axis compared with Fig 2.

