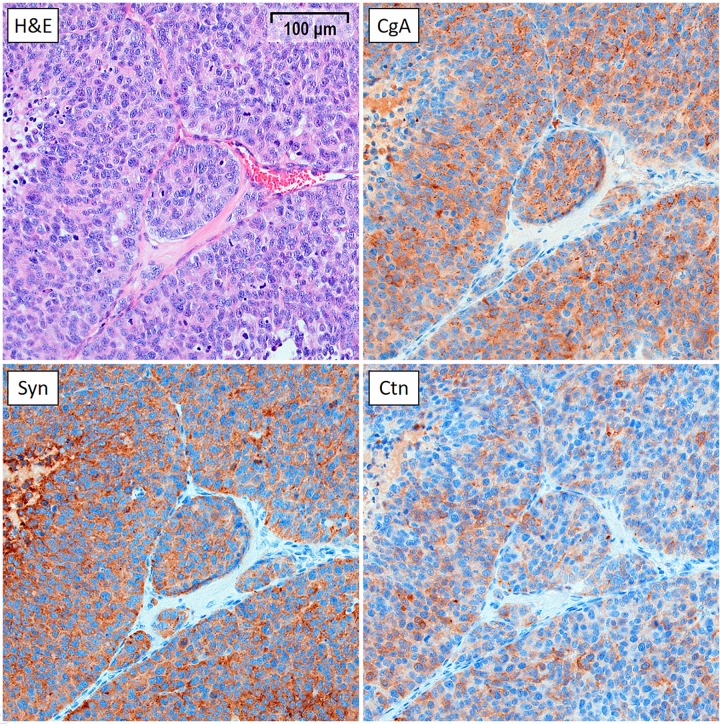
Fig 3. IHC staining of a representative GOT2 tumour (20x magnification).
The tumour was harvested from an animal in the untreated control group 30 days after start of treatment. The growth curve for this tumour was similar to the mean growth curve of the control group. The tumour was stained with haematoxylin and eosin (H&E), as well as for MTC markers chromogranin A (CgA), synaptophysin (Syn), and calcitonin (Ctn).

