
Figure 1.
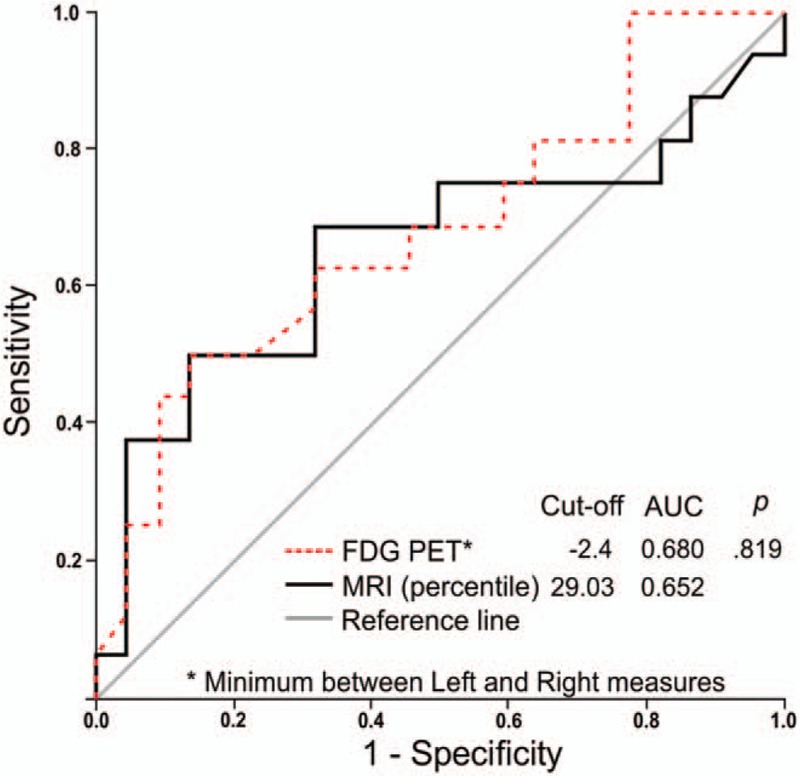
ROC curves constructed from the percentile of the hippocampal volume on MRI, and the hippocampus with the lowest result (in standard deviations) on FDG-PET. AUC = area under curve, FDG-PET = fluorodeoxyglucose positron emission tomography, MRI = magnetic resonance imaging, ROC = receiver operating characteristic.