
Figure 4.
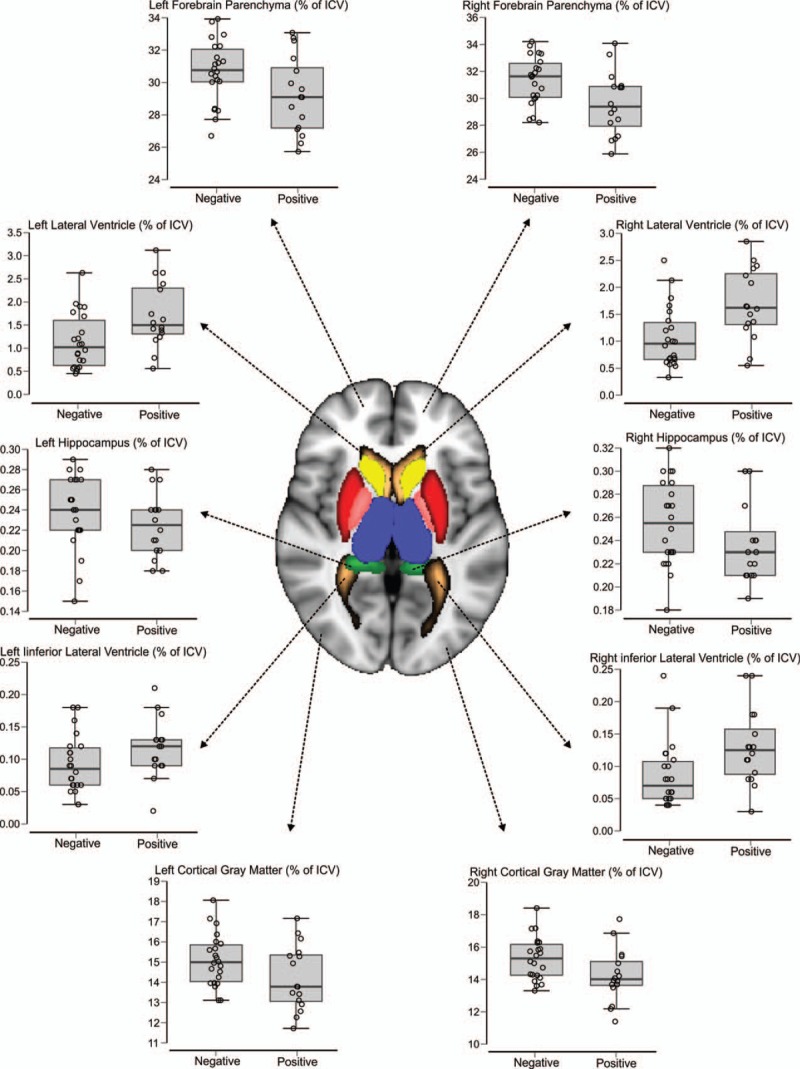
Quantitative analysis of MRI. The image colors represent the following brain regions: dark blue – thalamus, yellow – caudate, red – putamen, pink – pallidum, green – hippocampus, light blue – amygdala, pink and white – cerebellum, gray – cortical gray matter, brown – inferior lateral ventricle and lateral ventricle, and forebrain parenchyma (sum of the white matter and gray matter). ICV = intracranial volume, MRI = magnetic resonance imaging.