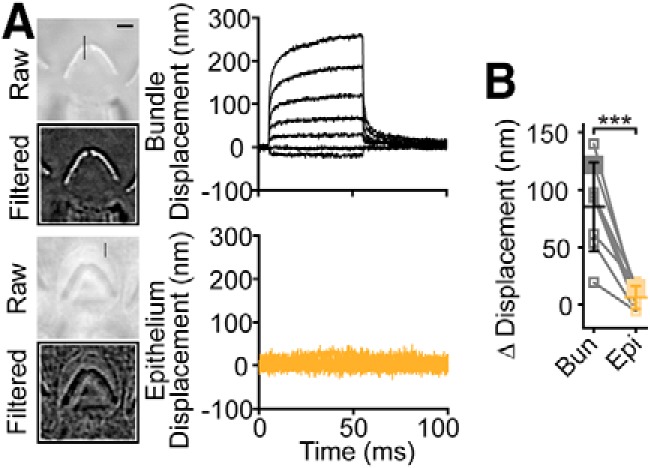
Figure 2.

Hair-bundle creep was not due to epithelium movement. A, Stimulation of the hair bundle led to hair-bundle creep (black traces) that was not visible in the epithelium movement (orange traces). Raw and filtered images are shown with the location of measured motion shown using the vertical black line in the raw image. Horizontal scale bar, 2 μm. B, Summary of the change in displacement of the hair bundle (Bun) or epithelium (Epi) from 0.5 ms after stimulus onset to the end of the stimulus step for the largest stimulation is plotted (n = 8, t(7) = 6.18, p = 0.00045). Mean ± SD shown. Lines connect data from the same cell with the same stimulus intensity. Data from A are shown with larger symbols. ***p < 0.001.
