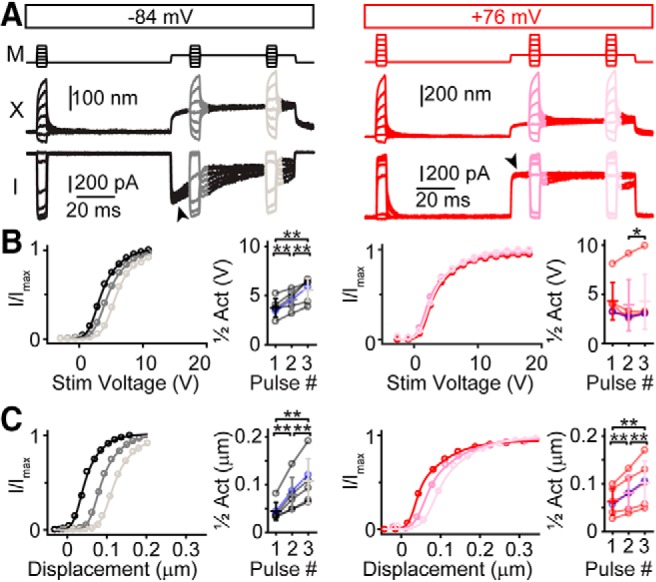
Figure 4.

Three-pulse experiments to assay adaptation shifts using a fluid-jet stimulus and 0.1 mm BAPTA intracellular solution. A, Voltage commands for the fluid jet in a three-pulse protocol are shown (M) at −84 mV (black) and at +76 mV (red) holding potentials with measured hair bundle displacements (X) and currents (I). Arrowheads indicate current decay at negative, but not positive potentials. B, Analyzing data with the stimulus voltage showed activation curve shifts at negative potentials, but not positive potentials. Summary data of half activation points for each stimulus pulse show positive adaptation shifts at negative (n = 6; Pulses 1–2: t(5) = −5.40, p = 0.0029; Pulses 2–3 t(5) = −4.46, p = 0.0066; Pulses 1–3: t(5) = −5.07, p = 0.0039), but not positive potentials (n = 6; Pulses 1–2: t(5) = 1.20, p = 0.28; Pulses 2–3: t(5) = −2.89, p = 0.034; Pulses 1–3: t(5) = 0.0789, p = 0.94). Blue data points are from traces in A. C, Analyzing data with measured hair bundle displacement indicates adaptation shifts at both negative (n = 6; Pulses 1–2: t(5) = −4.77, p = 0.0050; Pulses 2–3: t(5) = −5.80, p = 0.0021; Pulses 1–3: t(5) = −5.24, p = 0.0033), and positive potentials (n = 6; Pulses 1–2: t(5) = −4.89, p = 0.0045; Pulses 2–3: t(5) = −4.99, p = 0.0042; Pulses 1–3: t(5) = −5.05, p = 0.0039). Data from the same cell are connected by lines with mean ± SD shown in summary plots. The relative hair bundle stiffness at positive potentials was 18 ± 16% (n = 6) less stiff than at negative potentials as measured just before the third pulse. *p < 0.05, **p < 0.01.
