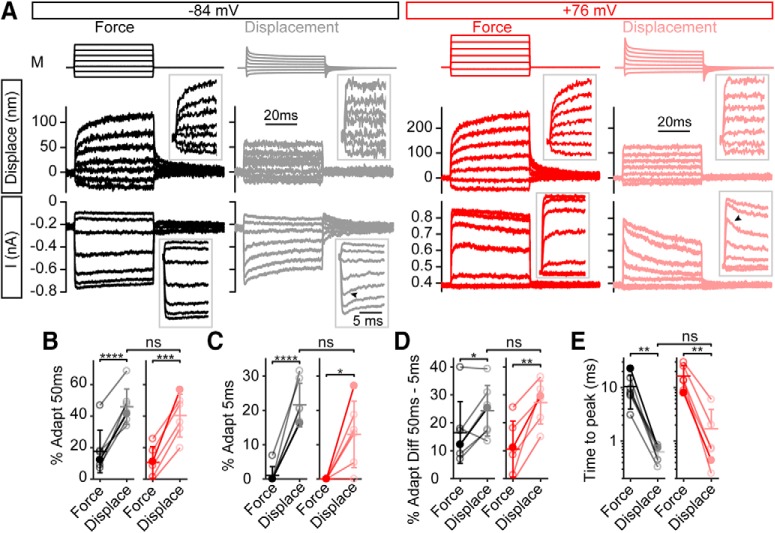
Figure 5.
Step-like hair bundle displacement with the fluid jet unmasked fast adaptation in the current response. A, At negative potentials, step-like force stimulation (black) resulted in hair bundle creep with no visible fast adaptation in the current. With step-like displacement stimuli (gray), fast adaptation in the current was visible (inset, arrowhead). Similarly, at positive potentials, no fast adaptation was observed with step-like force stimulation (red), but fast adaptation was unmasked with step-like displacements (pink, arrowhead). Displacement was measured in the vertical direction near the middle of the hair bundle at the same location for each stimulus paradigm. Inset traces are expanded to fill the space to better see the onset of the stimuli. B, Summary of the amount of total adaptation at the 50 ms time point between the step-like force and step-like displacement stimulation showed a significant difference between force and displacement stimuli (n = 7, −84 mV: t(6) = −9.25, p = 0.000090; n = 6, +76 mV: t(5) = −7.71, p = 0.00038). C, The amount of adaptation at 5 ms would have most fast adaptations complete and a small contribution from the slow adaptation process. Adaptation at 5 ms also showed a significant increase indicating the presence of fast adaptation (n = 7, −84 mV: t(6) = −10.06, p = 0.000056; n = 6, +76 mV: t(5) = −3.29, p = 0.022). D, The difference in adaptation between the 50 and 5 ms time points would be almost completely composed of slow adaptation. This had a significant increase at +76 mV with step-like displacements (n = 7, −84 mV: t(6) = −2.77, p = 0.032; n = 6, +76 mV: t(5) = −5.18, p = 0.0028). For all adaptation quantifications, step-like displacement responses were not significantly different between negative and positive potentials. E, Using step-like displacements shortens the time to peak current at both negative and positive potentials (n = 7, −84 mV: t(6) = 4.05, p = 0.0067; n = 6, +76 mV: t(5) = 4.68, p = 0.0038), but not significantly different when comparing negative and positive potentials (t(5) = −1.24, p = 0.27). Filled data points are from the example cell in A. Data from the same cell is connected with lines with mean ± SD shown in summary plots. *p < 0.05, **p < 0.01, ***p < 0.001, ****p < 0.0001.

