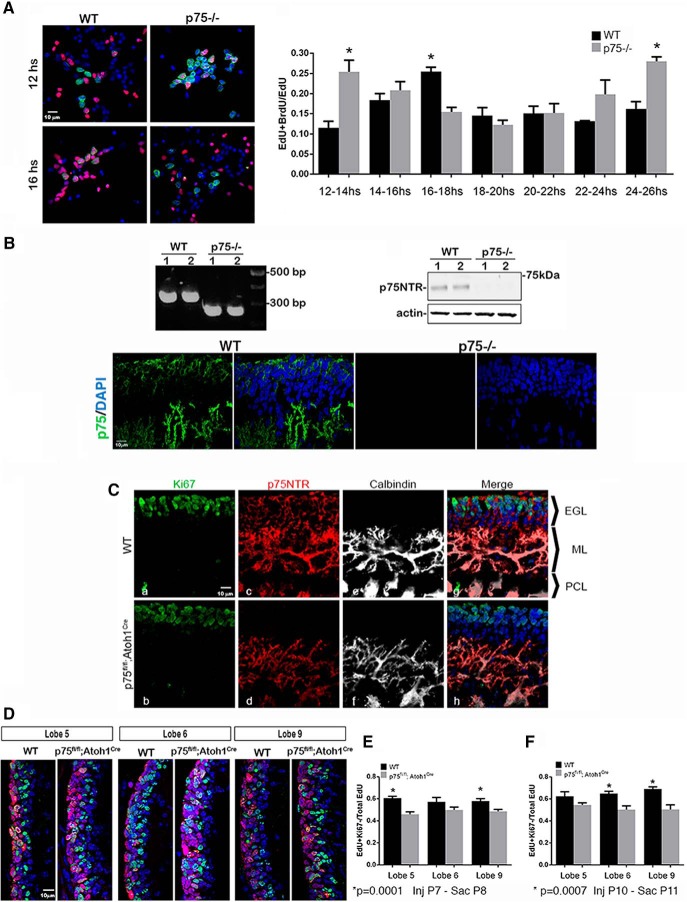
Figure 1.
Increase in cell cycle speed in GCPs lacking p75NTR. A, Granule cell cultures from WT and p75NTR−/− rats labeled with EdU (red) and BrdU (green). Edu was added for 1 h and washed out; BrdU was added for 2 h window between 12 and 24 h after the EdU. Cells were fixed and stained for both markers. EdU- and BrdU-positive cells represent cells that undergo a second round of S phase in the indicated time after the EdU pulse. The proliferation fraction represented as the ratio of double-labeled cells over the total EdU-positive cells. p = 0.0003 (Sidak's post hoc test following a two-way ANOVA test, F(6,56) = 5.063). B, Validation of the p75 KO rat by genotyping (primer sequence, forward: CAGCGCAGTTCAGCTCAG and reverse: CGCTCGCTCTGAAAGTCCTA). Absence of p75 protein demonstrated by Western blot and immunostaining. C, p75NTR is expressed in proliferating GCPs of P7 WT (top) mouse cerebellum and is deleted from the EGL of p75NTRfl/fl; Atoh1Cre (bottom) mice. Ca–Ch, High magnification of lobe 9, immunostained for Ki67 (Ca, Cb, green), p75NTR (Cc, Cd, magenta), calbindin (Ce, Cf white), and merged images with DAPI (blue) (Cg, Ch). Note the deletion of p75NTR specifically from EGL (Cg, Ch), while it remains expressed in PCs colocalized with calbindin. D, Sagittal sections of lobes 5, 6, and 9 from WT and p75NTRfl/fl; Atoh1Cre. Animals were injected with EdU at P7, killed 24 h later, and stained for Ki67 (red) and EdU (green). EdU-positive/Ki6-positive cells represent proliferating cells; EdU-positive/Ki67-negative cells represent cells that exited the cell cycle during those 24 h. E, Quantification of the quitting fraction experiments shown in D. The quitting fraction is represented as the ratio of EdU-positive and Ki67-negative cells over the total number of EdU-positive cells. p < 0.0001 (Sidak's post hoc test following a two-way ANOVA test, F(1,38) = 26.73). F, Quantification of the quitting fraction experiments with EdU injected at P10 and analyzed 24 h later. p < 0.0001 (Sidak's post hoc test following a two-way ANOVA test, F(1,21) = 29.77). Error bars indicate mean ± SEM. *Significant at the indicated p value.

