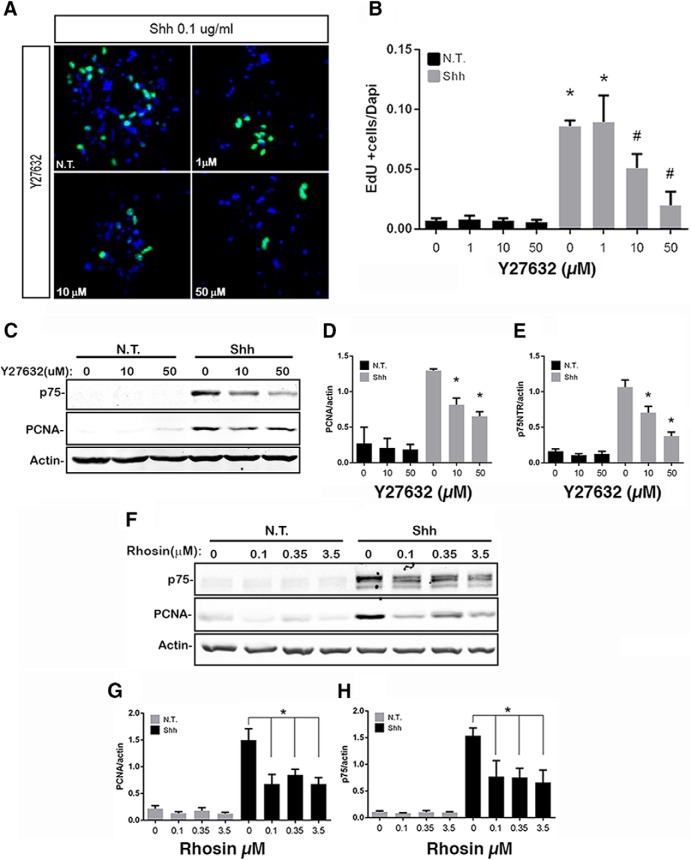
Figure 3.
Effects of RhoA inhibition on GCP proliferation. A, B, Granule cells were cultured in the presence or absence of Shh and exposed to different concentrations of the ROCK inhibitor Y27632. A, Cells stained for EdU (green) and DAPI (blue). B, Quantification of proliferation levels expressed as the number of EdU-positive cells divided by the number of DAPI-positive cells. Three independent experiments were analyzed. p < 0.0001 (Tukey's post hoc analysis following a one-way ANOVA test, F(7,16) = 39.89). C–E, Western blot analysis of GCP proliferation levels exposed to ROCK inhibitor in the absence or presence of Shh. C, Representative blot showing expression of p75NTR, PCNA, and actin. D, Quantification of PCNA levels normalized to actin levels. p < 0.0001 (Tukey's post hoc analysis following a one-way ANOVA test, F(5,18) = 35.46). E, Quantification of p75NTR expression levels normalized to actin. p < 0.0001 (Tukey's post hoc analysis following a one-way ANOVA test, F(5,24) = 27.43). At least four independent experiments were analyzed. F–H, Western blot analysis of GCP proliferation levels exposed to Rhosin, a RhoA inhibitor. F, Representative blot showing expression of p75NTR, PCNA, and actin. G, PCNA expression levels normalized with actin expression levels. p < 0.0001 (Tukey's post hoc analysis following a one-way ANOVA test, F(7,16) = 17.21). H, p75NTR expression levels normalized with actin expression levels. p < 0.0001 (Tukey's post hoc analysis following a one-way ANOVA test, F(7,16) = 11.19). Three independent experiments were analyzed. Error bars indicate mean ± SEM. *indicates different from untreated control, #indicates different from Shh alone.

