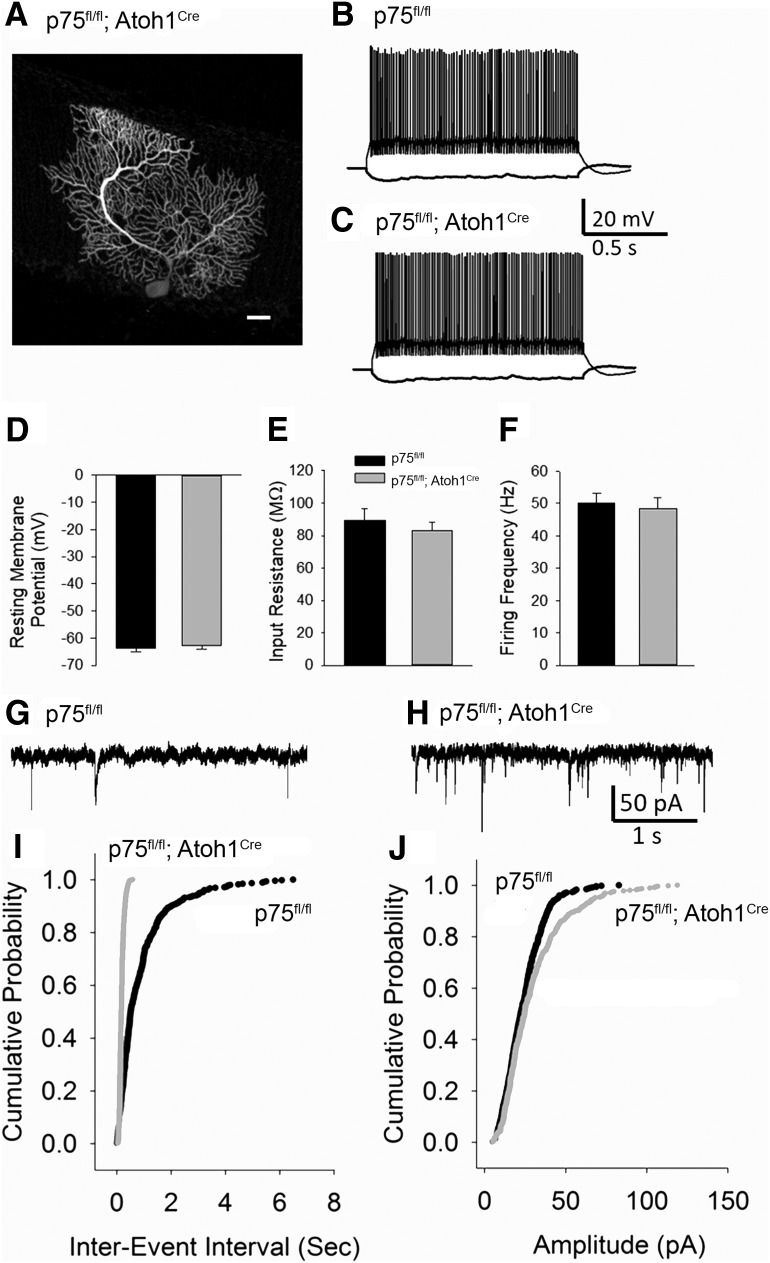
Figure 4.
Increase in spontaneous excitatory synaptic currents in cerebellar PCs of p75NTRfl/fl; Atoh1Cre mice compared with p75NTRfl/fl littermates. A, Example confocal image of biocytin-filled PCs recorded from a p75NTRfl/fl; Atoh1Cre mice. Scale bar, 40 μm. B, C, Representative current-voltage plots recorded in PCs in response to −200 and 80 pA current injections in p75NTRfl/fl (indicated as WT) (B) and p75NTRfl/fl; Atoh1Cre mice (C). D–F, Summary histograms compare resting membrane potential (D), input resistance measured in response to a −200 pA current injection (E), and average firing frequency in response to an 80 pA (F) between p75NTRfl/fl and p75NTRfl/fl; Atoh1Cre mice. G, H, Sample PC sEPSC traces in p75NTRfl/fl (WT) mice (G) and p75NTRfl/fl; Atoh1Cre mice (H). I, J, Summary cumulative probability plots of sEPSCs interevent interval (I) and amplitude (J) from 9 cells each from 3 WT mice and 3 p75NTRfl/fl; Atoh1Cre mice. p < 0.05 (Kolmogorov–Smirnov test). Error bars indicate mean ± SEM.

